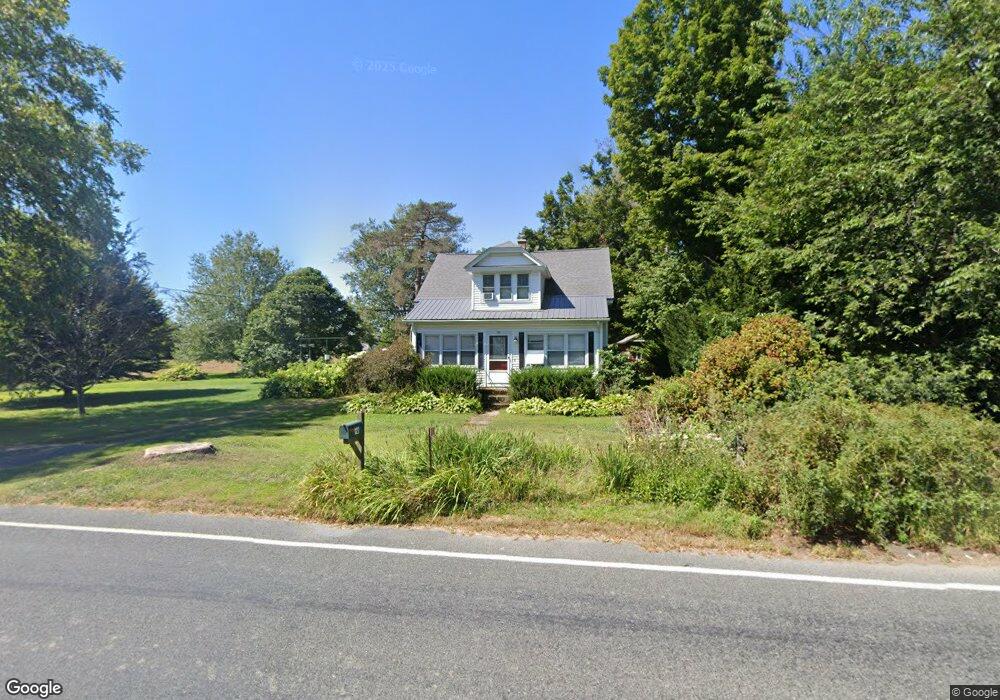
127 East St Hadley, MA 01035
Estimated Value: $502,768 - $613,000
4
Beds
2
Baths
1,935
Sq Ft
$283/Sq Ft
Est. Value
About This Home
This home is located at 127 East St, Hadley, MA 01035 and is currently estimated at $547,692, approximately $283 per square foot. 127 East St is a home located in Hampshire County with nearby schools including Hadley Elementary School, Pioneer Valley Chinese Immersion Charter School, and The Hartsbrook School.
Ownership History
Date
Name
Owned For
Owner Type
Purchase Details
Closed on
Aug 8, 2018
Sold by
Bakaj John A
Bought by
Abel Chester E and Scott Janet B
Current Estimated Value
Purchase Details
Closed on
Aug 4, 2003
Sold by
Hinton George and Hinton June
Bought by
June Hinton Lt
Purchase Details
Closed on
Mar 12, 1997
Sold by
Bakaj Adolph J and Bakaj John A
Bought by
Abel Chester E and Scott Janet B
Create a Home Valuation Report for This Property
The Home Valuation Report is an in-depth analysis detailing your home's value as well as a comparison with similar homes in the area
Home Values in the Area
Average Home Value in this Area
Purchase History
| Date | Buyer | Sale Price | Title Company |
|---|---|---|---|
| Abel Chester E | $2,000 | -- | |
| June Hinton Lt | -- | -- | |
| Abel Chester E | $125,000 | -- |
Source: Public Records
Mortgage History
| Date | Status | Borrower | Loan Amount |
|---|---|---|---|
| Previous Owner | Abel Chester E | $140,000 |
Source: Public Records
Tax History Compared to Growth
Tax History
| Year | Tax Paid | Tax Assessment Tax Assessment Total Assessment is a certain percentage of the fair market value that is determined by local assessors to be the total taxable value of land and additions on the property. | Land | Improvement |
|---|---|---|---|---|
| 2025 | $4,880 | $419,600 | $134,000 | $285,600 |
| 2024 | $4,608 | $404,600 | $134,000 | $270,600 |
| 2023 | $4,496 | $389,600 | $134,000 | $255,600 |
| 2022 | $4,298 | $352,900 | $134,000 | $218,900 |
| 2021 | $4,045 | $337,100 | $134,000 | $203,100 |
| 2020 | $4,056 | $317,400 | $134,000 | $183,400 |
| 2019 | $4,054 | $328,000 | $134,000 | $194,000 |
| 2018 | $3,860 | $319,300 | $132,900 | $186,400 |
| 2017 | $3,518 | $304,100 | $132,900 | $171,200 |
| 2016 | $3,391 | $304,100 | $132,900 | $171,200 |
| 2015 | $3,303 | $304,100 | $132,900 | $171,200 |
| 2014 | $3,236 | $304,100 | $132,900 | $171,200 |
Source: Public Records
Map
Nearby Homes