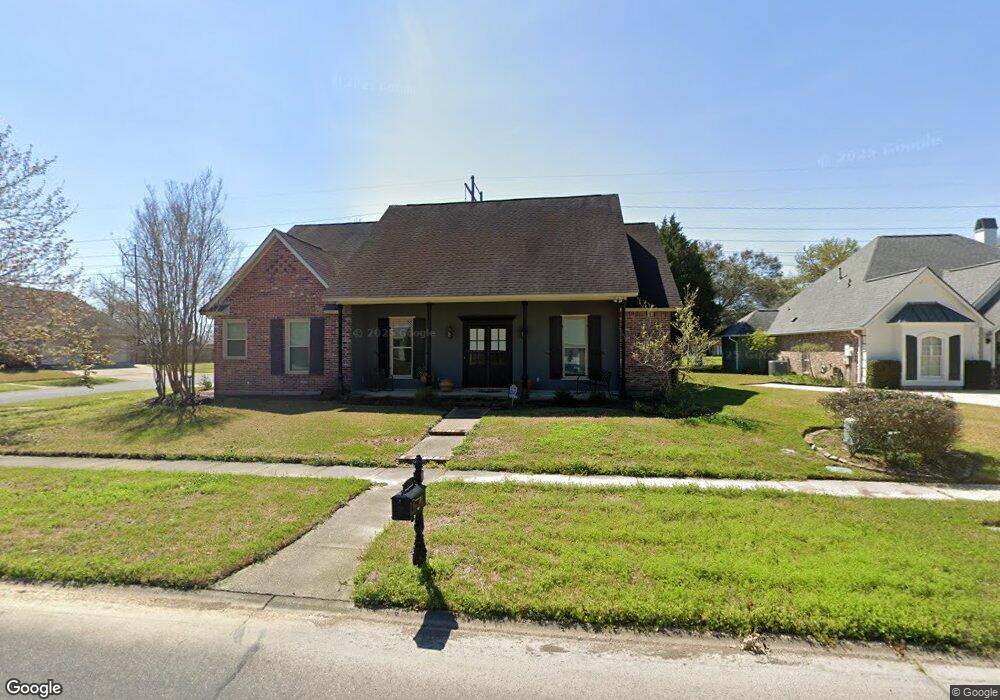
12736 Oxley Dr Baton Rouge, LA 70816
Shenandoah NeighborhoodEstimated Value: $400,000 - $457,702
4
Beds
3
Baths
2,717
Sq Ft
$157/Sq Ft
Est. Value
About This Home
This home is located at 12736 Oxley Dr, Baton Rouge, LA 70816 and is currently estimated at $425,567, approximately $156 per square foot. 12736 Oxley Dr is a home located in East Baton Rouge Parish with nearby schools including Cedarcrest-Southmoor Elementary School, Southeast Middle School, and Tara High School.
Ownership History
Date
Name
Owned For
Owner Type
Purchase Details
Closed on
Sep 16, 2005
Sold by
Plaisance Robert J
Bought by
Tuminello Bradley R
Current Estimated Value
Purchase Details
Closed on
Jul 28, 1999
Sold by
Heritage Homes Inc
Bought by
Plaisance Robert Joseph and Plaisance Nancy Fresina
Home Financials for this Owner
Home Financials are based on the most recent Mortgage that was taken out on this home.
Original Mortgage
$140,000
Interest Rate
7.63%
Mortgage Type
Purchase Money Mortgage
Purchase Details
Closed on
Apr 20, 1999
Sold by
Consolidated Interests Inc
Bought by
Heritage Homes Inc
Purchase Details
Closed on
Aug 21, 1998
Sold by
Oxley Corporation
Bought by
Consolidated Interests Inc
Home Financials for this Owner
Home Financials are based on the most recent Mortgage that was taken out on this home.
Original Mortgage
$44,000
Interest Rate
6.9%
Mortgage Type
Purchase Money Mortgage
Create a Home Valuation Report for This Property
The Home Valuation Report is an in-depth analysis detailing your home's value as well as a comparison with similar homes in the area
Home Values in the Area
Average Home Value in this Area
Purchase History
| Date | Buyer | Sale Price | Title Company |
|---|---|---|---|
| Tuminello Bradley R | $275,000 | -- | |
| Plaisance Robert Joseph | $50,000 | -- | |
| Heritage Homes Inc | $48,200 | -- | |
| Consolidated Interests Inc | $44,000 | -- |
Source: Public Records
Mortgage History
| Date | Status | Borrower | Loan Amount |
|---|---|---|---|
| Previous Owner | Plaisance Robert Joseph | $140,000 | |
| Previous Owner | Consolidated Interests Inc | $44,000 |
Source: Public Records
Tax History Compared to Growth
Tax History
| Year | Tax Paid | Tax Assessment Tax Assessment Total Assessment is a certain percentage of the fair market value that is determined by local assessors to be the total taxable value of land and additions on the property. | Land | Improvement |
|---|---|---|---|---|
| 2024 | $3,173 | $33,825 | $5,500 | $28,325 |
| 2023 | $3,173 | $32,780 | $5,500 | $27,280 |
| 2022 | $3,914 | $32,780 | $5,500 | $27,280 |
| 2021 | $3,824 | $32,780 | $5,500 | $27,280 |
| 2020 | $3,872 | $32,780 | $5,500 | $27,280 |
| 2019 | $3,681 | $29,800 | $5,000 | $24,800 |
| 2018 | $3,636 | $29,800 | $5,000 | $24,800 |
| 2017 | $3,636 | $29,800 | $5,000 | $24,800 |
| 2016 | $2,752 | $29,800 | $5,000 | $24,800 |
| 2015 | $2,483 | $27,500 | $5,000 | $22,500 |
| 2014 | $2,475 | $27,500 | $5,000 | $22,500 |
| 2013 | -- | $27,500 | $5,000 | $22,500 |
Source: Public Records
Map
Nearby Homes
- 12847 Oxley Dr
- 12829 Stutgart Ave
- 4352 Stumberg Ln
- 4436 Stumberg Ln
- 4410 Stumberg Ln
- 4342 Stumberg Ln
- 4398 Stumberg Ln
- 4372 Stumberg Ln Unit 27
- 12937 Roundlake Dr
- 4454 Stumberg Ln
- 4456 Stumberg Ln
- 4130 Country Glen Dr
- 12426 Lake Sherwood Ave N
- 4220 Lake Sherwood Ave E
- 3134 Woodland Ridge Blvd
- 12526 Beldart Ct
- 12326 Lake Sherwood Ave S
- 16149 Chancel Ave Unit A2
- 16153 Chancel Ave Unit B2
- 16133 Chancel Ave Unit A2
- 12726 Oxley Dr
- 12808 Oxley Dr
- 0 Oxley Dr
- 12716 Oxley Dr
- 3737 Sir William Ct
- 12661 Humphreys Dr
- 12745 Oxley Dr
- 12722 Humphreys Dr
- 12644 Oxley Dr
- 12817 Oxley Dr
- 0 Humphreys Dr
- 3727 Sir William Ct
- 12827 Oxley Dr
- 12712 Humphreys Dr
- 12634 Oxley Dr
- 12651 Humphreys Dr
- 12641 Humphreys Dr
- 12838 Oxley Dr
- 12837 Oxley Dr
- 3726 Sir William Ct