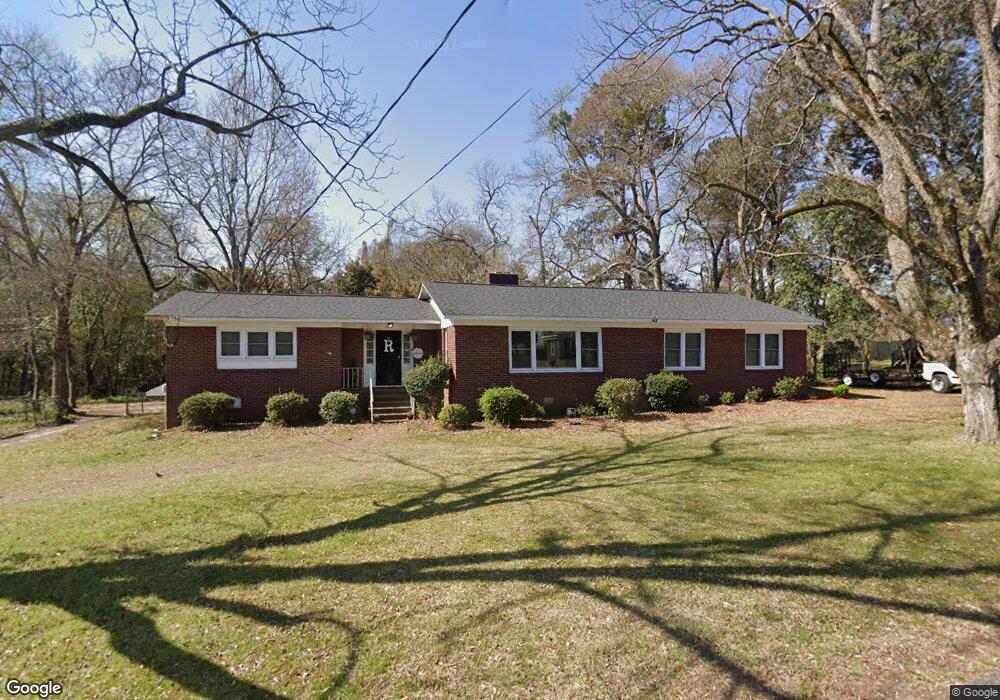
1275 Glen Gloria St Orangeburg, SC 29118
Estimated Value: $164,000 - $206,678
4
Beds
2
Baths
1,956
Sq Ft
$96/Sq Ft
Est. Value
About This Home
This home is located at 1275 Glen Gloria St, Orangeburg, SC 29118 and is currently estimated at $188,420, approximately $96 per square foot. 1275 Glen Gloria St is a home located in Orangeburg County with nearby schools including Marshall Elementary School, Marshall Elementary, and William J. Clark Middle School.
Ownership History
Date
Name
Owned For
Owner Type
Purchase Details
Closed on
Dec 6, 2018
Sold by
Keitt Lois D and Lawton Ella M
Bought by
Ritter Jermaine D and Lawton Etta M
Current Estimated Value
Home Financials for this Owner
Home Financials are based on the most recent Mortgage that was taken out on this home.
Original Mortgage
$103,098
Outstanding Balance
$92,261
Interest Rate
5.62%
Mortgage Type
FHA
Estimated Equity
$96,159
Purchase Details
Closed on
May 6, 2011
Sold by
Keitt Edna M
Bought by
Keitt Lois D and Lawton Ella M
Purchase Details
Closed on
Mar 16, 2011
Sold by
Lawton Ella M and Keitt Lois D
Bought by
Keitt Edna M
Purchase Details
Closed on
Mar 15, 2011
Sold by
Estate Of Willie Keitt Jr and Keitt Edna M
Bought by
Keitt Edna M and Lawton Ella M
Purchase Details
Closed on
Dec 31, 2001
Sold by
Lanier Kenya and Carter Kenya Lanier
Bought by
Keitt Willie and Keitt Edna M
Create a Home Valuation Report for This Property
The Home Valuation Report is an in-depth analysis detailing your home's value as well as a comparison with similar homes in the area
Home Values in the Area
Average Home Value in this Area
Purchase History
| Date | Buyer | Sale Price | Title Company |
|---|---|---|---|
| Ritter Jermaine D | $105,000 | None Available | |
| Keitt Lois D | -- | -- | |
| Keitt Edna M | -- | -- | |
| Keitt Edna M | -- | -- | |
| Keitt Willie | $78,000 | -- |
Source: Public Records
Mortgage History
| Date | Status | Borrower | Loan Amount |
|---|---|---|---|
| Open | Ritter Jermaine D | $103,098 |
Source: Public Records
Tax History Compared to Growth
Tax History
| Year | Tax Paid | Tax Assessment Tax Assessment Total Assessment is a certain percentage of the fair market value that is determined by local assessors to be the total taxable value of land and additions on the property. | Land | Improvement |
|---|---|---|---|---|
| 2024 | $1,012 | $5,907 | $599 | $5,308 |
| 2023 | $808 | $4,576 | $564 | $4,012 |
| 2022 | $785 | $4,576 | $564 | $4,012 |
| 2021 | $776 | $4,576 | $564 | $4,012 |
| 2020 | $2,448 | $4,576 | $564 | $4,012 |
| 2019 | $762 | $4,576 | $564 | $4,012 |
| 2018 | $459 | $4,435 | $563 | $3,872 |
| 2017 | $442 | $4,435 | $0 | $0 |
| 2016 | $442 | $4,435 | $0 | $0 |
| 2015 | $419 | $4,435 | $0 | $0 |
| 2014 | $419 | $4,436 | $564 | $3,872 |
| 2013 | -- | $3,987 | $563 | $3,424 |
Source: Public Records
Map
Nearby Homes
- 1757 Saint Matthews Rd
- 0 Decatur St NE
- 1118 Decatur St NE
- 0 Essex Dr
- 0 Hidden Valley Dr NE
- 1697 Enderly St
- 1446 Ridgewood Dr
- 1671 Desota St
- 0 Soloman Terrace
- 722 Stilton Rd
- 1438 Lartique Dr
- 1188 Gloria St
- 1069 Chestnut St
- 3210 Hunter Dr
- 2565 Saint Matthews Rd NE
- 1135 Gloria St
- 1238 Dantzler St
- 1236 College Ave
- 1549 Ashley St
- 1895 Columbia Rd
- 1285 Glen Gloria St
- 1253 Glen Gloria St
- 1280 Glen Gloria St
- 1246 Glen Gloria St
- 1288 Glen Gloria St
- 1237 Glen Gloria St
- 1226 Brickle St
- 1230 Brickle St
- 1250 Brickle St
- 1294 Glen Gloria St
- 1222 Brickle St
- 1251 Glen Gloria St
- 1215 Glen Gloria St
- 1988 St Matthews Rd
- 0 Brickle St
- 1920 Saint Matthews Rd NE
- 1992 Saint Matthews Rd
- 1223 Brickle St
- 1890 Saint Matthews Rd
- 1890 Saint Matthews Rd