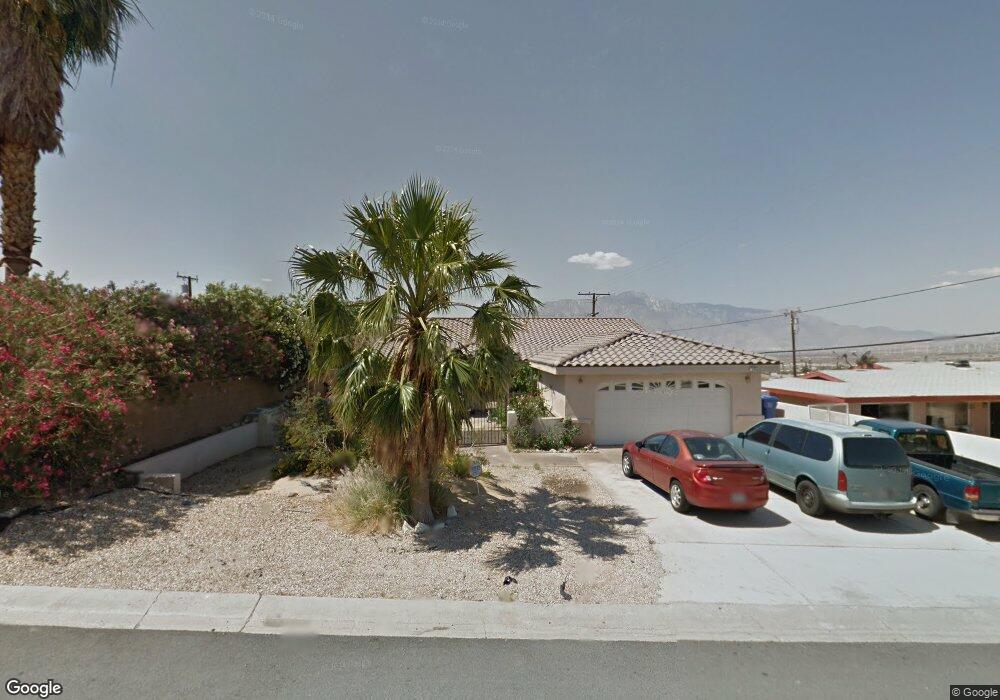
12753 Catalpa Ave Desert Hot Springs, CA 92240
Estimated Value: $375,000 - $478,000
4
Beds
2
Baths
1,948
Sq Ft
$223/Sq Ft
Est. Value
About This Home
This home is located at 12753 Catalpa Ave, Desert Hot Springs, CA 92240 and is currently estimated at $434,462, approximately $223 per square foot. 12753 Catalpa Ave is a home located in Riverside County with nearby schools including Julius Corsini Elementary School, Desert Springs Middle School, and Desert Hot Springs High School.
Ownership History
Date
Name
Owned For
Owner Type
Purchase Details
Closed on
Jun 19, 2008
Sold by
Ruiz Maria Guadalupe Guillermo
Bought by
Moreno Juan C
Current Estimated Value
Purchase Details
Closed on
Apr 11, 2008
Sold by
Lasalle Bank Na
Bought by
Moreno Juan C
Home Financials for this Owner
Home Financials are based on the most recent Mortgage that was taken out on this home.
Original Mortgage
$171,000
Interest Rate
5.99%
Mortgage Type
Purchase Money Mortgage
Purchase Details
Closed on
Feb 8, 2007
Sold by
Huynh Long Hai
Bought by
Lasalle Bank Na
Purchase Details
Closed on
Nov 9, 2005
Sold by
L Cooper Development Inc
Bought by
Huynh Long Hai
Home Financials for this Owner
Home Financials are based on the most recent Mortgage that was taken out on this home.
Original Mortgage
$311,200
Interest Rate
8.69%
Mortgage Type
Balloon
Purchase Details
Closed on
Nov 19, 2003
Sold by
Levit Ilya and Levit Eugenia
Bought by
L Cooper Development Inc
Create a Home Valuation Report for This Property
The Home Valuation Report is an in-depth analysis detailing your home's value as well as a comparison with similar homes in the area
Home Values in the Area
Average Home Value in this Area
Purchase History
| Date | Buyer | Sale Price | Title Company |
|---|---|---|---|
| Moreno Juan C | -- | Fidelity National Title | |
| Moreno Juan C | $195,000 | Fidelity National Title | |
| Lasalle Bank Na | $3,000 | None Available | |
| Huynh Long Hai | $389,000 | Orange Coast Title Company | |
| L Cooper Development Inc | $26,500 | First American Title |
Source: Public Records
Mortgage History
| Date | Status | Borrower | Loan Amount |
|---|---|---|---|
| Previous Owner | Moreno Juan C | $171,000 | |
| Previous Owner | Huynh Long Hai | $311,200 |
Source: Public Records
Tax History Compared to Growth
Tax History
| Year | Tax Paid | Tax Assessment Tax Assessment Total Assessment is a certain percentage of the fair market value that is determined by local assessors to be the total taxable value of land and additions on the property. | Land | Improvement |
|---|---|---|---|---|
| 2025 | $3,681 | $256,111 | $64,020 | $192,091 |
| 2023 | $3,681 | $246,168 | $61,535 | $184,633 |
| 2022 | $3,627 | $241,342 | $60,329 | $181,013 |
| 2021 | $3,489 | $236,611 | $59,147 | $177,464 |
| 2020 | $3,344 | $234,186 | $58,541 | $175,645 |
| 2019 | $3,277 | $229,595 | $57,394 | $172,201 |
| 2018 | $3,196 | $225,094 | $56,269 | $168,825 |
| 2017 | $3,169 | $220,681 | $55,166 | $165,515 |
| 2016 | $2,650 | $182,000 | $45,000 | $137,000 |
| 2015 | $2,589 | $182,000 | $45,000 | $137,000 |
| 2014 | $2,086 | $140,000 | $35,000 | $105,000 |
Source: Public Records
Map
Nearby Homes
- 12965 Catalpa Ave
- 12537 Spruce St
- 0 Skyline Unit IV25142557
- 13115 Acacia Ave
- 0 Spruce Unit 219137939DA
- 0 Beech Unit JT25071888
- 0 Fernwood Dr Unit OC24184086
- 68480 Hacienda Ave
- 0 Calle Calmoso Unit 219124270DA
- 13215 Deodar Ave
- 12315 Avenida Alta Loma
- 68206 Calle Azteca
- 13829 Scenic Crest Cir
- 0 Club Circle Dr Unit 219120841DA
- 0 Sky Ridge Way
- 68205 Calle Azteca
- 12735 Avenida Alta Loma
- 0 Avenida la Vista Unit IG25030276
- 01 Skyline Dr
- 13845 Scenic Crest Cir
- 12775 Catalpa Ave
- 12725 Catalpa Ave
- 12750 Beech Ave
- 12721 Catalpa Ave
- 12770 Beech Ave
- 12811 Catalpa Ave
- 12700 Beech Ave
- 12780 Beech Ave
- 12750 Catalpa Ave
- 12770 Catalpa Ave
- 12780 Catalpa Ave
- 12700 Catalpa Ave
- 12800 Beech Ave
- 12798 Catalpa Ave
- 12845 Catalpa Ave
- 12822 Catalpa Ave
- 12685 Deodar Ave
- 12775 Beech Ave
- 12725 Beech Ave
- 12705 Redbud Rd