128 Turtle Creek Rd Unit 5 Charlottesville, VA 22901
29 North NeighborhoodEstimated Value: $230,702 - $248,000
2
Beds
2
Baths
989
Sq Ft
$239/Sq Ft
Est. Value
About This Home
This home is located at 128 Turtle Creek Rd Unit 5, Charlottesville, VA 22901 and is currently estimated at $236,176, approximately $238 per square foot. 128 Turtle Creek Rd Unit 5 is a home located in Albemarle County with nearby schools including Mary Carr Greer Elementary School, Journey Middle School, and Albemarle High School.
Ownership History
Date
Name
Owned For
Owner Type
Purchase Details
Closed on
Jun 25, 2025
Sold by
Todays Property Management Ii Llc
Bought by
Todays Property Management Iv Llc
Current Estimated Value
Purchase Details
Closed on
Jun 21, 2019
Sold by
Barnett Brittany Marie
Bought by
Today S Property Management Ii Llc
Purchase Details
Closed on
Sep 25, 2013
Sold by
Takagi Sue L
Bought by
Barnett Brittany M
Home Financials for this Owner
Home Financials are based on the most recent Mortgage that was taken out on this home.
Original Mortgage
$12,490
Interest Rate
4.56%
Mortgage Type
New Conventional
Purchase Details
Closed on
Jun 15, 2010
Sold by
Proctor William Todd
Bought by
Takagi Sue Lynn
Create a Home Valuation Report for This Property
The Home Valuation Report is an in-depth analysis detailing your home's value as well as a comparison with similar homes in the area
Home Values in the Area
Average Home Value in this Area
Purchase History
| Date | Buyer | Sale Price | Title Company |
|---|---|---|---|
| Todays Property Management Iv Llc | -- | None Listed On Document | |
| Today S Property Management Ii Llc | $129,000 | Chicago Title Insurance Co | |
| Barnett Brittany M | $124,900 | -- | |
| Takagi Sue Lynn | $130,000 | -- |
Source: Public Records
Mortgage History
| Date | Status | Borrower | Loan Amount |
|---|---|---|---|
| Previous Owner | Barnett Brittany M | $12,490 | |
| Previous Owner | Barnett Brittany M | $92,900 |
Source: Public Records
Tax History Compared to Growth
Tax History
| Year | Tax Paid | Tax Assessment Tax Assessment Total Assessment is a certain percentage of the fair market value that is determined by local assessors to be the total taxable value of land and additions on the property. | Land | Improvement |
|---|---|---|---|---|
| 2025 | $1,912 | $213,900 | $35,500 | $178,400 |
| 2024 | $1,666 | $195,100 | $29,000 | $166,100 |
| 2023 | $1,503 | $176,000 | $25,000 | $151,000 |
| 2022 | $1,446 | $169,300 | $25,000 | $144,300 |
| 2021 | $1,273 | $149,100 | $25,000 | $124,100 |
| 2020 | $1,198 | $140,300 | $25,000 | $115,300 |
| 2019 | $1,095 | $128,200 | $25,000 | $103,200 |
| 2018 | $943 | $115,000 | $25,000 | $90,000 |
| 2017 | $920 | $109,700 | $25,000 | $84,700 |
| 2016 | $944 | $112,500 | $25,000 | $87,500 |
| 2015 | $470 | $114,700 | $30,000 | $84,700 |
| 2014 | -- | $113,700 | $30,000 | $83,700 |
Source: Public Records
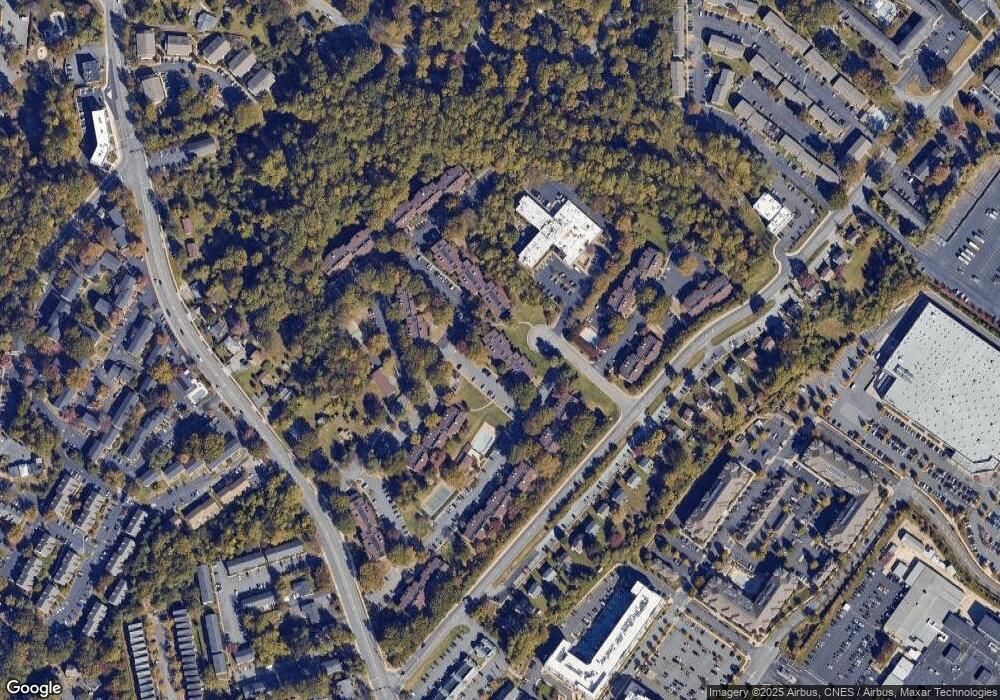
Map
Nearby Homes
- 127 Turtle Creek Rd Unit 12
- 103 Turtle Creek Rd Unit 3
- 122 Turtle Creek Rd Unit 2
- 132 Turtle Creek Rd Unit 11
- 116 Turtle Creek Rd Unit 2
- 2752 Hydraulic Rd
- 505 Georgetown Rd
- 1904 Inglewood Dr
- 1904 Inglewood Dr Unit E
- 1715 Solomon Rd
- 2304 Shelby Dr
- TBD Seminole Trail
- 1619 Inglewood Dr
- 2301 N Berkshire Rd Unit A and B
- 1518 Birnam Dr
- 1511 Westfield Ct
- 128 Turtle Creek Rd Unit 12
- 128 Turtle Creek Rd Unit 11
- 128 Turtle Creek Rd Unit 10
- 128 Turtle Creek Rd Unit 9
- 128 Turtle Creek Rd Unit 8
- 128 Turtle Creek Rd Unit 7
- 128 Turtle Creek Rd Unit 6
- 128 Turtle Creek Rd Unit 4
- 128 Turtle Creek Rd Unit 3
- 128 Turtle Creek Rd Unit 2
- 128 Turtle Creek Rd Unit 1
- 128 Turtle Creek Rd
- 128 #6 Turtle Creek Rd
- 128 Turtle Creek Rd
- 126 Turtle Creek Rd
- 126 Turtle Creek Rd Unit 12
- 126 Turtle Creek Rd Unit 11
- 126 Turtle Creek Rd Unit 10
- 126 Turtle Creek Rd Unit 9
- 126 Turtle Creek Rd Unit 8