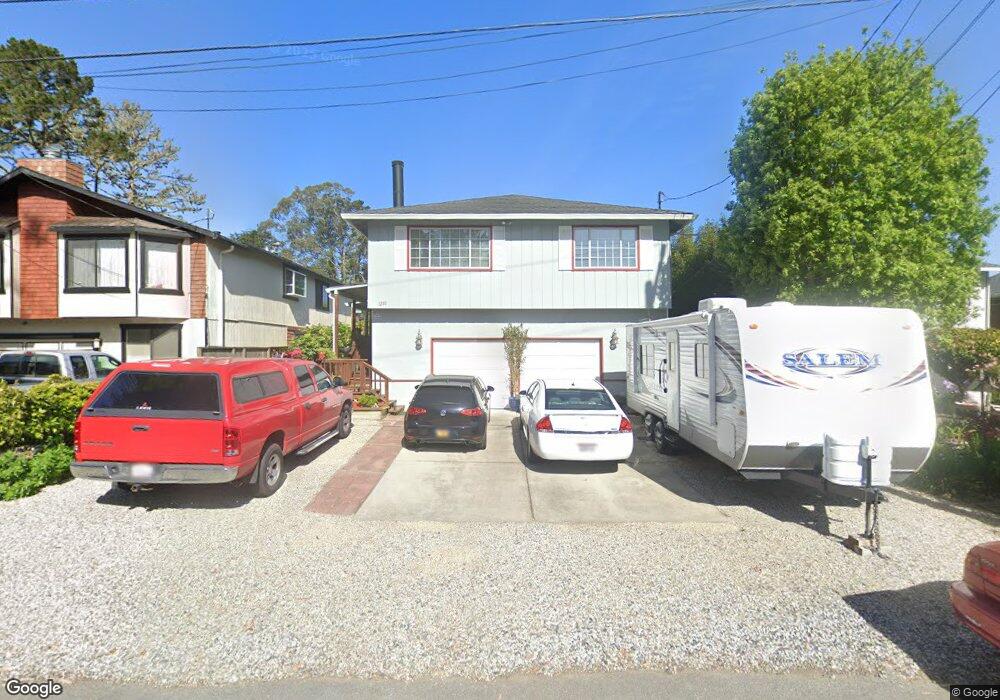
1280 Birch St Montara, CA 94037
Estimated Value: $1,224,000 - $1,521,000
3
Beds
2
Baths
1,380
Sq Ft
$950/Sq Ft
Est. Value
About This Home
This home is located at 1280 Birch St, Montara, CA 94037 and is currently estimated at $1,311,118, approximately $950 per square foot. 1280 Birch St is a home with nearby schools including Farallone View Elementary School, Manuel F. Cunha Intermediate School, and Half Moon Bay High School.
Ownership History
Date
Name
Owned For
Owner Type
Purchase Details
Closed on
Oct 14, 2021
Sold by
Swanson Eric H and Blough Barbi J
Bought by
Swanson Eric H and Blough Barbi J
Current Estimated Value
Home Financials for this Owner
Home Financials are based on the most recent Mortgage that was taken out on this home.
Original Mortgage
$275,000
Interest Rate
2.1%
Mortgage Type
New Conventional
Purchase Details
Closed on
Oct 16, 2015
Sold by
Swanson Eric H and Blough Barbi J
Bought by
The Eric Swanson & Barbi Blough Living T
Create a Home Valuation Report for This Property
The Home Valuation Report is an in-depth analysis detailing your home's value as well as a comparison with similar homes in the area
Home Values in the Area
Average Home Value in this Area
Purchase History
| Date | Buyer | Sale Price | Title Company |
|---|---|---|---|
| Swanson Eric H | -- | Lawyers Title Company | |
| Swanson Eric H | -- | Lawyers Title Company | |
| The Eric Swanson & Barbi Blough Living T | -- | None Available |
Source: Public Records
Mortgage History
| Date | Status | Borrower | Loan Amount |
|---|---|---|---|
| Closed | Swanson Eric H | $275,000 |
Source: Public Records
Tax History Compared to Growth
Tax History
| Year | Tax Paid | Tax Assessment Tax Assessment Total Assessment is a certain percentage of the fair market value that is determined by local assessors to be the total taxable value of land and additions on the property. | Land | Improvement |
|---|---|---|---|---|
| 2025 | $7,920 | $377,999 | $133,968 | $244,031 |
| 2023 | $7,920 | $363,323 | $128,767 | $234,556 |
| 2022 | $7,891 | $356,200 | $126,243 | $229,957 |
| 2021 | $7,590 | $349,217 | $123,768 | $225,449 |
| 2020 | $7,263 | $345,637 | $122,499 | $223,138 |
| 2019 | $6,735 | $338,861 | $120,098 | $218,763 |
| 2018 | $6,270 | $332,218 | $117,744 | $214,474 |
| 2017 | $5,626 | $325,705 | $115,436 | $210,269 |
| 2016 | $5,585 | $319,320 | $113,173 | $206,147 |
| 2015 | $5,263 | $314,525 | $111,474 | $203,051 |
| 2014 | $5,406 | $308,365 | $109,291 | $199,074 |
Source: Public Records
Map
Nearby Homes