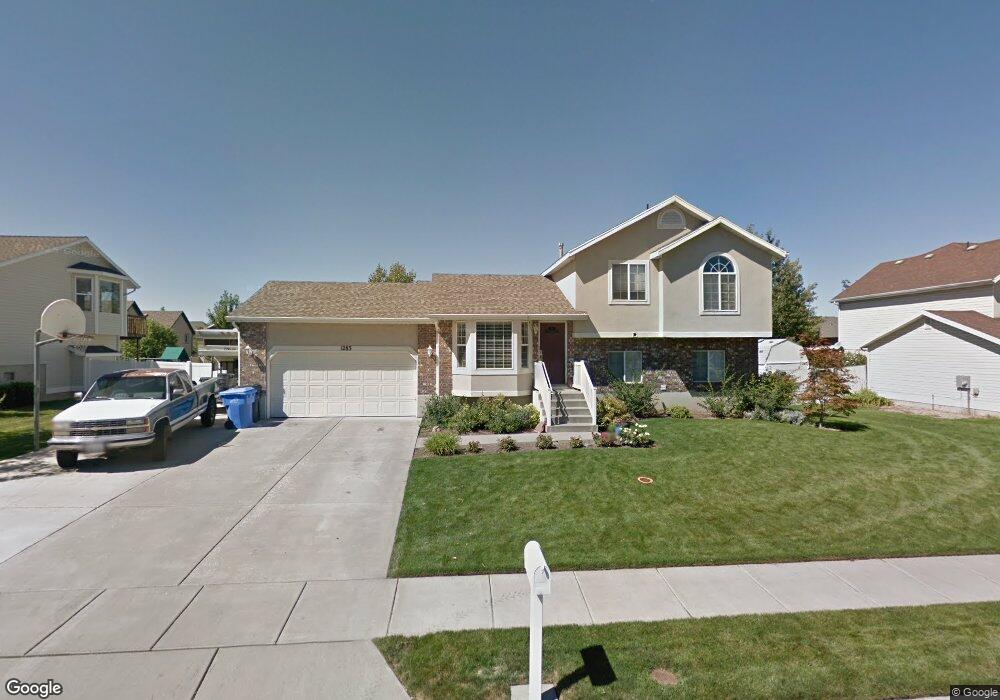
1283 N 600 W West Bountiful, UT 84087
Estimated Value: $502,000 - $550,737
4
Beds
3
Baths
1,094
Sq Ft
$485/Sq Ft
Est. Value
About This Home
This home is located at 1283 N 600 W, West Bountiful, UT 84087 and is currently estimated at $530,434, approximately $484 per square foot. 1283 N 600 W is a home located in Davis County with nearby schools including West Bountiful Elementary School, Bountiful Junior High School, and Viewmont High School.
Ownership History
Date
Name
Owned For
Owner Type
Purchase Details
Closed on
Jan 22, 2020
Sold by
Jensen Jerrell K and Jensen Wendl L
Bought by
Jensen Jerrell K and Jensen Wendi Lyn
Current Estimated Value
Home Financials for this Owner
Home Financials are based on the most recent Mortgage that was taken out on this home.
Original Mortgage
$246,100
Outstanding Balance
$168,824
Interest Rate
3.73%
Mortgage Type
New Conventional
Estimated Equity
$361,610
Purchase Details
Closed on
Dec 31, 1997
Sold by
Gmw Development Inc
Bought by
Gmw Development Inc
Home Financials for this Owner
Home Financials are based on the most recent Mortgage that was taken out on this home.
Original Mortgage
$135,500
Interest Rate
6.95%
Create a Home Valuation Report for This Property
The Home Valuation Report is an in-depth analysis detailing your home's value as well as a comparison with similar homes in the area
Home Values in the Area
Average Home Value in this Area
Purchase History
| Date | Buyer | Sale Price | Title Company |
|---|---|---|---|
| Jensen Jerrell K | -- | Silver Leaf Title Insu | |
| Gmw Development Inc | -- | Bonneville Title Company Inc | |
| Jensen Jerrell K | -- | Bonneville Title Company Inc |
Source: Public Records
Mortgage History
| Date | Status | Borrower | Loan Amount |
|---|---|---|---|
| Open | Jensen Jerrell K | $246,100 | |
| Previous Owner | Jensen Jerrell K | $135,500 |
Source: Public Records
Tax History Compared to Growth
Tax History
| Year | Tax Paid | Tax Assessment Tax Assessment Total Assessment is a certain percentage of the fair market value that is determined by local assessors to be the total taxable value of land and additions on the property. | Land | Improvement |
|---|---|---|---|---|
| 2025 | $3,280 | $286,000 | $135,297 | $150,703 |
| 2024 | $3,091 | $275,550 | $111,128 | $164,422 |
| 2023 | $2,654 | $430,000 | $211,154 | $218,846 |
| 2022 | $2,731 | $248,050 | $100,547 | $147,503 |
| 2021 | $2,458 | $342,000 | $134,296 | $207,704 |
| 2020 | $2,157 | $296,000 | $125,662 | $170,338 |
| 2019 | $2,091 | $284,000 | $127,637 | $156,363 |
| 2018 | $1,951 | $260,000 | $129,136 | $130,864 |
| 2016 | $1,678 | $121,550 | $32,621 | $88,929 |
| 2015 | $1,556 | $106,645 | $32,621 | $74,024 |
| 2014 | $1,299 | $90,691 | $32,621 | $58,070 |
| 2013 | -- | $101,693 | $36,222 | $65,471 |
Source: Public Records
Map
Nearby Homes
- 637 W 1600 N
- Lincoln Farmhouse Plan at Belmont Farms
- Belmont Traditional Plan at Belmont Farms
- Hampton Traditional Plan at Belmont Farms
- 366 W 1000 N
- 825 W 1320 N
- 1503 N 300 W
- 790 N 500 W
- 235 W 1400 N
- 1410 N 200 W
- 1194 N 200 W
- 1260 N 200 W
- 1552 N 200 W
- 789 W 1950 N
- 239 Lyman Ln
- 234 Leah Cir
- 184 Park Shadows Cir
- 580 W 2125 N
- 204 Lyman Ln
- 548 S 675 W