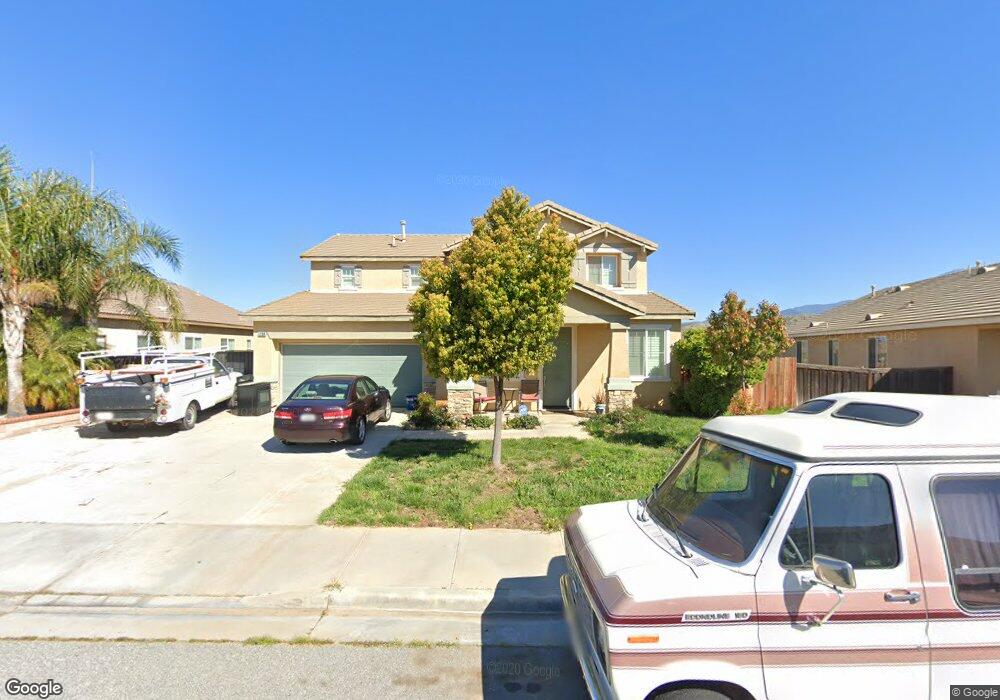
1288 Santa Paula Ct Beaumont, CA 92223
Estimated Value: $556,000 - $623,000
5
Beds
3
Baths
2,923
Sq Ft
$200/Sq Ft
Est. Value
About This Home
This home is located at 1288 Santa Paula Ct, Beaumont, CA 92223 and is currently estimated at $584,089, approximately $199 per square foot. 1288 Santa Paula Ct is a home located in Riverside County with nearby schools including Brookside Elementary School, Mountain View Middle School, and Beaumont Senior High School.
Ownership History
Date
Name
Owned For
Owner Type
Purchase Details
Closed on
Sep 22, 2014
Sold by
Thompson Terri and Thompson Roger
Bought by
Thompson Trust
Current Estimated Value
Purchase Details
Closed on
May 26, 2009
Sold by
U S Bank National Association
Bought by
Thompson Terri and Thompson Roger
Home Financials for this Owner
Home Financials are based on the most recent Mortgage that was taken out on this home.
Original Mortgage
$149,200
Outstanding Balance
$94,216
Interest Rate
4.76%
Mortgage Type
Purchase Money Mortgage
Estimated Equity
$489,873
Purchase Details
Closed on
Sep 4, 2008
Sold by
Fox Zachary David
Bought by
U S Bank Na
Purchase Details
Closed on
Jun 2, 2005
Sold by
Fox Denise
Bought by
Fox Zachary David
Purchase Details
Closed on
Jan 27, 2005
Sold by
Beaumont 194 Llc
Bought by
Fox Zachary David
Home Financials for this Owner
Home Financials are based on the most recent Mortgage that was taken out on this home.
Original Mortgage
$358,948
Interest Rate
5.62%
Mortgage Type
Fannie Mae Freddie Mac
Create a Home Valuation Report for This Property
The Home Valuation Report is an in-depth analysis detailing your home's value as well as a comparison with similar homes in the area
Home Values in the Area
Average Home Value in this Area
Purchase History
| Date | Buyer | Sale Price | Title Company |
|---|---|---|---|
| Thompson Trust | -- | None Available | |
| Thompson Terri | $186,500 | Old Republic Title Company | |
| U S Bank Na | $271,058 | None Available | |
| Fox Zachary David | -- | Chicago Title Company | |
| Fox Zachary David | $449,000 | Chicago Title |
Source: Public Records
Mortgage History
| Date | Status | Borrower | Loan Amount |
|---|---|---|---|
| Open | Thompson Terri | $149,200 | |
| Previous Owner | Fox Zachary David | $358,948 |
Source: Public Records
Tax History Compared to Growth
Tax History
| Year | Tax Paid | Tax Assessment Tax Assessment Total Assessment is a certain percentage of the fair market value that is determined by local assessors to be the total taxable value of land and additions on the property. | Land | Improvement |
|---|---|---|---|---|
| 2025 | $5,673 | $240,147 | $77,252 | $162,895 |
| 2023 | $5,673 | $230,823 | $74,253 | $156,570 |
| 2022 | $5,567 | $226,298 | $72,798 | $153,500 |
| 2021 | $5,521 | $221,862 | $71,371 | $150,491 |
| 2020 | $5,487 | $219,588 | $70,640 | $148,948 |
| 2019 | $5,408 | $215,283 | $69,255 | $146,028 |
| 2018 | $5,412 | $211,063 | $67,899 | $143,164 |
| 2017 | $5,597 | $206,925 | $66,568 | $140,357 |
| 2016 | $5,684 | $202,868 | $65,263 | $137,605 |
| 2015 | $5,583 | $199,823 | $64,284 | $135,539 |
| 2014 | $5,527 | $195,911 | $63,026 | $132,885 |
Source: Public Records
Map
Nearby Homes
- 1757 Desert Poppy Ln
- 1729 Desert Poppy Ln
- 1185 Lantana Rd
- 1164 Blackbrush Rd
- 1165 Wisteria Way
- 1158 Blackbrush Rd
- 1778 Dalea Way
- 1755 Brittney Rd
- 1763 Brittney Rd
- 1140 Lantana Rd
- 1660 Snowberry Rd
- 0 Champions Dr
- 11582 Bunker Place
- 36965 Bay Hill Dr
- 1791 Hannon Rd
- 36719 Torrey Pines Dr
- 36308 Eagle Ln
- 36864 Straightaway Dr
- 36948 Gallery Ln
- 36109 Eagle Ln
- 1290 Santa Paula Ct
- 1284 Santa Paula Ct
- 1294 Santa Paula Ct
- 1280 Santa Paula Ct
- 1285 Santa Paula Ct
- 1289 Santa Paula Ct
- 1775 N Deodar Dr
- 1283 Santa Paula Ct
- 1293 Santa Paula Ct
- 1296 Santa Paula Ct
- 1739 N Deodar Dr
- 1295 Santa Paula Ct
- 1278 Oakhurst Ct
- 1733 N Deodar Dr
- 1281 Katherine Ct
- 1279 Oakhurst Ct
- 1297 Santa Paula Ct
- 1746 N Deodar Dr
- 1740 N Deodar Dr
- 1727 N Deodar Dr