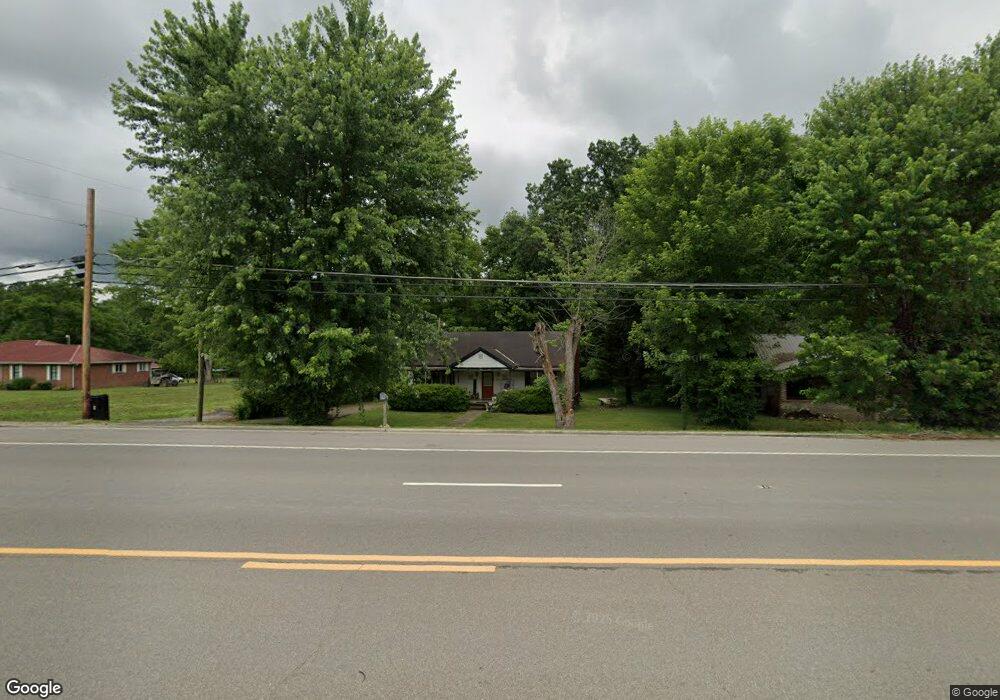
12895 Scott Hwy Helenwood, TN 37755
Estimated Value: $98,851 - $222,000
--
Bed
1
Bath
1,120
Sq Ft
$150/Sq Ft
Est. Value
About This Home
This home is located at 12895 Scott Hwy, Helenwood, TN 37755 and is currently estimated at $168,213, approximately $150 per square foot. 12895 Scott Hwy is a home located in Scott County with nearby schools including Scott High School and Landmark Christian Academy.
Ownership History
Date
Name
Owned For
Owner Type
Purchase Details
Closed on
Feb 16, 1996
Bought by
Burress Jackie L and Burress Retha T
Current Estimated Value
Purchase Details
Closed on
Jun 17, 1971
Bought by
Burress Jackie L and Burress Donna
Create a Home Valuation Report for This Property
The Home Valuation Report is an in-depth analysis detailing your home's value as well as a comparison with similar homes in the area
Home Values in the Area
Average Home Value in this Area
Purchase History
| Date | Buyer | Sale Price | Title Company |
|---|---|---|---|
| Burress Jackie L | -- | -- | |
| Burress Jackie L | -- | -- |
Source: Public Records
Tax History Compared to Growth
Tax History
| Year | Tax Paid | Tax Assessment Tax Assessment Total Assessment is a certain percentage of the fair market value that is determined by local assessors to be the total taxable value of land and additions on the property. | Land | Improvement |
|---|---|---|---|---|
| 2024 | -- | $23,550 | $7,225 | $16,325 |
| 2023 | $495 | $23,550 | $7,225 | $16,325 |
| 2022 | $393 | $13,250 | $5,150 | $8,100 |
| 2021 | $392 | $13,250 | $5,150 | $8,100 |
| 2020 | $326 | $13,250 | $5,150 | $8,100 |
| 2019 | $393 | $13,250 | $5,150 | $8,100 |
| 2018 | $326 | $13,250 | $5,150 | $8,100 |
| 2017 | $346 | $11,675 | $3,225 | $8,450 |
| 2016 | $336 | $11,675 | $3,225 | $8,450 |
| 2015 | $322 | $11,675 | $3,225 | $8,450 |
| 2014 | $322 | $11,675 | $3,225 | $8,450 |
Source: Public Records
Map
Nearby Homes
- 162 Coffee Dr
- at end of Fire Department Ln
- 146 Wright Dr
- 0 Scott Hwy Unit 24409462
- 0 Scott Hwy Unit 2.5AC 11551662
- 0 Scott Hwy Unit 3AC 11551673
- 0 Scott Hwy Unit 24409464
- 0 Helenwood Loop Rd Unit 24289292
- 0 Helenwood Loop Rd Unit 11545855
- 950 Elb Private Dr
- 191 Vance Dr
- 382 W Monticello Pike
- 233 Hickory Mill Rd
- 370 Cherokee Dr
- 2036 Helenwood Detour Rd
- 63 Scott Hwy
- 0 Sutherland Dr
- 1863 Old County Garage Rd
- 788 Old Jamestown Rd
- 10655 Scott Hwy
- 12855 Scott Hwy
- 432 Sulpher Creek Rd
- 12864 Scott Hwy
- 12900 Scott Hwy
- 12900 Scott Hwy
- 260 Hemlock Springs Dr
- 254 Hemlock Springs Dr
- 370 Sulpher Creek Rd
- 145 Virgil Cecil Rd
- 161 Virgil Cecil Rd
- 133 Virgil Cecil Rd
- 152 Main St
- 256 Helenwood Loop Rd
- 225 Virgil Cecil Rd
- 218 State Dr
- 293 Sulpher Creek Rd
- 231 Virgil Cecil Rd
- 13103 Scott Hwy
- 235 Virgil Cecil Rd
- 298 Main St Unit 298D