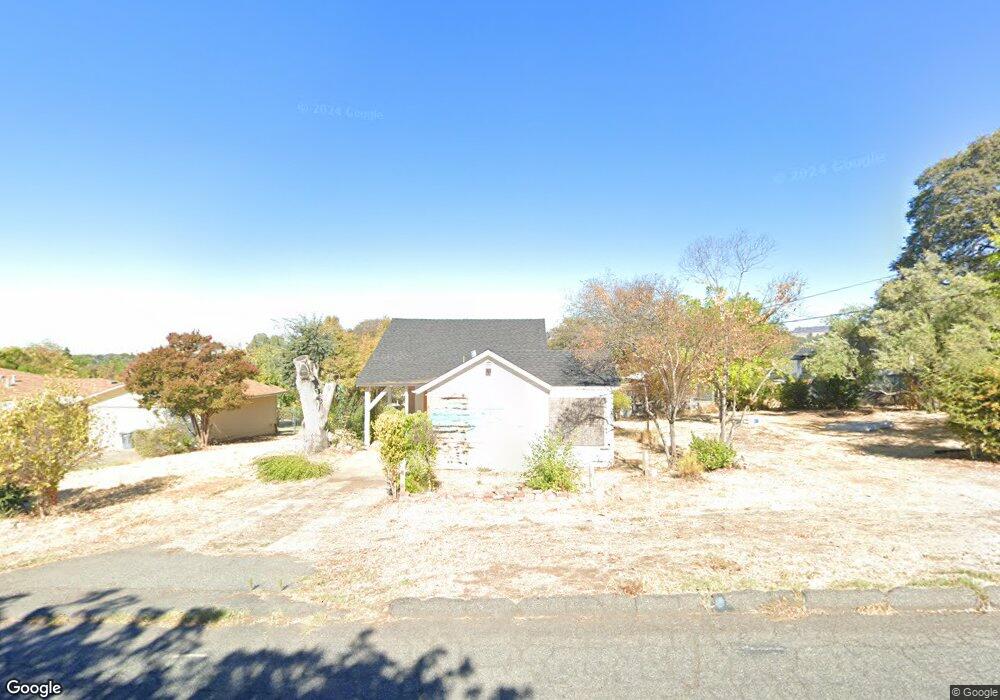
129 Canyon Highlands Dr Oroville, CA 95966
Estimated Value: $219,864 - $270,000
3
Beds
1
Bath
1,038
Sq Ft
$234/Sq Ft
Est. Value
About This Home
This home is located at 129 Canyon Highlands Dr, Oroville, CA 95966 and is currently estimated at $242,966, approximately $234 per square foot. 129 Canyon Highlands Dr is a home located in Butte County with nearby schools including Oroville High School, Ipakanni Early College Charter School, and Sierra School of Butte County.
Ownership History
Date
Name
Owned For
Owner Type
Purchase Details
Closed on
Apr 22, 2016
Sold by
Brown Leslie K and Brown Leslie Kim
Bought by
Brown Leslie K
Current Estimated Value
Home Financials for this Owner
Home Financials are based on the most recent Mortgage that was taken out on this home.
Original Mortgage
$80,091
Outstanding Balance
$63,690
Interest Rate
3.71%
Mortgage Type
New Conventional
Estimated Equity
$179,276
Purchase Details
Closed on
Sep 6, 2001
Sold by
Stevenson Norman P and Stevenson Elouise F
Bought by
Brown Leslie Kim
Home Financials for this Owner
Home Financials are based on the most recent Mortgage that was taken out on this home.
Original Mortgage
$70,000
Interest Rate
7%
Mortgage Type
Seller Take Back
Create a Home Valuation Report for This Property
The Home Valuation Report is an in-depth analysis detailing your home's value as well as a comparison with similar homes in the area
Home Values in the Area
Average Home Value in this Area
Purchase History
| Date | Buyer | Sale Price | Title Company |
|---|---|---|---|
| Brown Leslie K | -- | North American Title Co Inc | |
| Brown Leslie Kim | $75,000 | Mid Valley Title | |
| Brown Leslie Kim | -- | Mid Valley Title |
Source: Public Records
Mortgage History
| Date | Status | Borrower | Loan Amount |
|---|---|---|---|
| Open | Brown Leslie K | $80,091 | |
| Closed | Brown Leslie Kim | $70,000 |
Source: Public Records
Tax History Compared to Growth
Tax History
| Year | Tax Paid | Tax Assessment Tax Assessment Total Assessment is a certain percentage of the fair market value that is determined by local assessors to be the total taxable value of land and additions on the property. | Land | Improvement |
|---|---|---|---|---|
| 2025 | $2,007 | $128,498 | $44,305 | $84,193 |
| 2024 | $2,007 | $125,980 | $43,437 | $82,543 |
| 2023 | $2,282 | $123,511 | $42,586 | $80,925 |
| 2022 | $1,782 | $121,090 | $41,751 | $79,339 |
| 2021 | $1,736 | $118,717 | $40,933 | $77,784 |
| 2020 | $1,687 | $117,501 | $40,514 | $76,987 |
| 2019 | $1,667 | $115,198 | $39,720 | $75,478 |
| 2018 | $1,626 | $112,941 | $38,942 | $73,999 |
| 2017 | $1,586 | $110,728 | $38,179 | $72,549 |
| 2016 | $1,562 | $108,558 | $37,431 | $71,127 |
| 2015 | $1,488 | $106,928 | $36,869 | $70,059 |
| 2014 | $1,446 | $104,834 | $36,147 | $68,687 |
Source: Public Records
Map
Nearby Homes
- 30 Acacia Ave
- 21 Acacia Ave
- 22 Oak Park Way
- 3611 Ashley Ave
- 3637 Stauss Ave
- 33 Myrtle Dr
- 3415 Oro Dam Blvd E Unit 307
- 3415 Oro Dam Blvd E Unit 149
- 3415 Oro Dam Blvd E Unit 311
- 3415 Oro Dam Blvd E Unit 421
- 0 Orange Ave Unit OR24133137
- 25 Pamela Jane Ct
- 10 Service Cir
- 3425 Orange Ave Unit 22
- 0 Highlands Blvd Unit SN23181045
- 6 Coventry Ct
- 48 Pine Oaks Rd
- 2088 Campbell Ave
- 115 Acacia Ave
- 108 Valley View Dr
- 127 Canyon Highlands Dr
- 6 Donna St
- 135 Canyon Highlands Dr
- 4 Donna St
- 125 Canyon Highlands Dr
- 130 Canyon Highlands Dr
- 123 Canyon Highlands Dr
- 137 Canyon Highlands Dr
- 16 Acacia Ave
- 7 Donna St
- 132 Canyon Highlands Dr
- 5 Donna St
- 20 Acacia Ave
- 126 Canyon Highlands Dr
- 3 Donna St
- 141 Canyon Highlands Dr
- 24 Acacia Ave
- 121 Canyon Highlands Dr
- 124 Canyon Highlands Dr
- 28 Acacia Ave