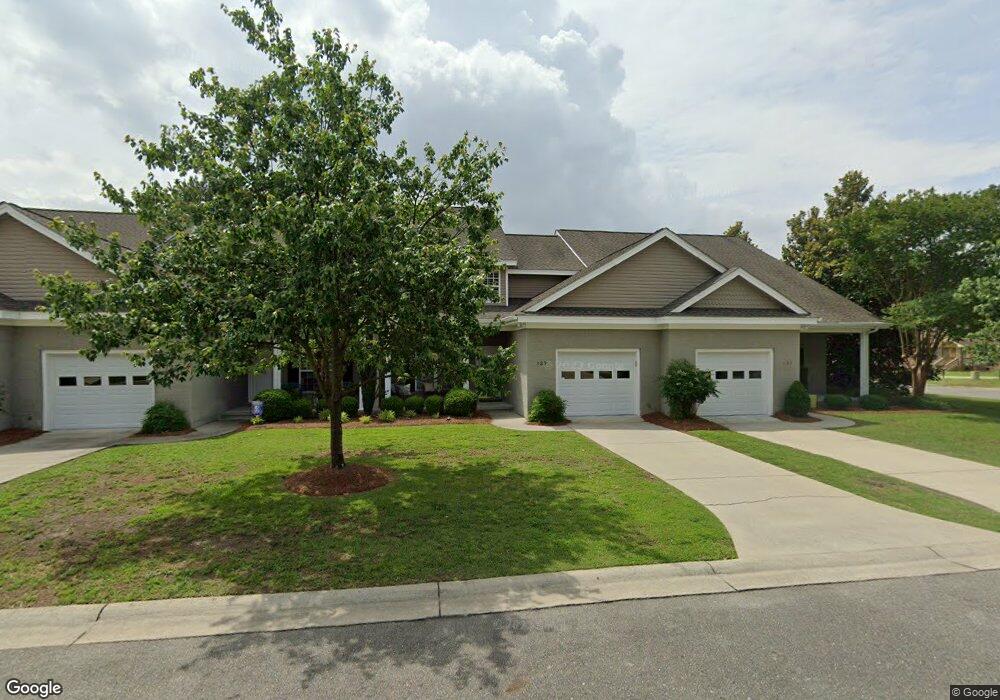
129 Chafin Place Goldsboro, NC 27534
Estimated Value: $249,000 - $330,000
3
Beds
3
Baths
2,013
Sq Ft
$136/Sq Ft
Est. Value
About This Home
This home is located at 129 Chafin Place, Goldsboro, NC 27534 and is currently estimated at $274,395, approximately $136 per square foot. 129 Chafin Place is a home located in Wayne County with nearby schools including Tommy's Road Elementary School, Eastern Wayne Middle School, and Eastern Wayne High School.
Ownership History
Date
Name
Owned For
Owner Type
Purchase Details
Closed on
Apr 28, 2014
Sold by
Best John R
Bought by
Herring Kenneth M and Herring Elaine H
Current Estimated Value
Home Financials for this Owner
Home Financials are based on the most recent Mortgage that was taken out on this home.
Original Mortgage
$181,000
Outstanding Balance
$138,149
Interest Rate
4.37%
Mortgage Type
VA
Estimated Equity
$136,246
Purchase Details
Closed on
May 12, 2006
Sold by
Quinton Gregory L and Quinton Janice B
Bought by
Best John R
Home Financials for this Owner
Home Financials are based on the most recent Mortgage that was taken out on this home.
Original Mortgage
$137,800
Interest Rate
6.39%
Mortgage Type
New Conventional
Purchase Details
Closed on
Aug 29, 2005
Sold by
Chafin Place Llc
Bought by
Quinton Gregory L and Quinton Janice B
Home Financials for this Owner
Home Financials are based on the most recent Mortgage that was taken out on this home.
Original Mortgage
$144,800
Interest Rate
5.61%
Mortgage Type
New Conventional
Create a Home Valuation Report for This Property
The Home Valuation Report is an in-depth analysis detailing your home's value as well as a comparison with similar homes in the area
Home Values in the Area
Average Home Value in this Area
Purchase History
| Date | Buyer | Sale Price | Title Company |
|---|---|---|---|
| Herring Kenneth M | $181,000 | None Available | |
| Best John R | $178,500 | None Available | |
| Quinton Gregory L | $181,000 | None Available |
Source: Public Records
Mortgage History
| Date | Status | Borrower | Loan Amount |
|---|---|---|---|
| Open | Herring Kenneth M | $181,000 | |
| Previous Owner | Best John R | $137,800 | |
| Previous Owner | Quinton Gregory L | $144,800 |
Source: Public Records
Tax History Compared to Growth
Tax History
| Year | Tax Paid | Tax Assessment Tax Assessment Total Assessment is a certain percentage of the fair market value that is determined by local assessors to be the total taxable value of land and additions on the property. | Land | Improvement |
|---|---|---|---|---|
| 2025 | $2,808 | $258,360 | $30,000 | $228,360 |
| 2024 | $2,305 | $189,710 | $25,000 | $164,710 |
| 2023 | $2,131 | $189,710 | $25,000 | $164,710 |
| 2022 | $2,059 | $189,710 | $25,000 | $164,710 |
| 2021 | $2,008 | $189,710 | $25,000 | $164,710 |
| 2020 | $1,901 | $189,710 | $25,000 | $164,710 |
| 2018 | $1,925 | $191,540 | $25,000 | $166,540 |
| 2017 | $1,925 | $191,540 | $25,000 | $166,540 |
| 2016 | $1,925 | $191,540 | $25,000 | $166,540 |
| 2015 | $1,927 | $191,540 | $25,000 | $166,540 |
| 2014 | $2,522 | $191,540 | $25,000 | $166,540 |
Source: Public Records
Map
Nearby Homes
- 138 Oxford Dr
- 136 Oxford Dr
- 101 Cox Blvd
- 517 Quail Dr
- 903 Coach House Cir
- 901 Coach House Cir
- 101 Cashwell Dr
- 407 Dove Place
- 607 Gloucester Rd
- 414 Cardinal Dr
- 605 Dellwood Place
- 1104 Wessex Ct
- 412 Cardinal Dr
- 711 N Spence Ave
- 102 Atsur Place
- 1506 Darby Place
- 100 E Lockhaven Dr
- 2501 Isaac Dr
- 117 Quail Dr
- 2503 Lisa Ln
- 127 Chafin Place
- 131 Chafin Place
- 125 Chafin Place
- 504 Chafin Rd
- 502 Chafin Rd
- 502 Chafin Rd
- 130 Chafin Place
- 500 Chafin Rd
- 128 Chafin Place
- 560 Chafin Rd
- 558 Chafin Rd
- 556 Chafin Rd
- 126 Chafin
- 117,119,12 Chafin Place
- 554 Chafin Rd
- 552 Chafin Rd
- 550 Chafin Rd
- 124 Chafin Place
- 105 Chafin Place
- 546 Chafin Rd