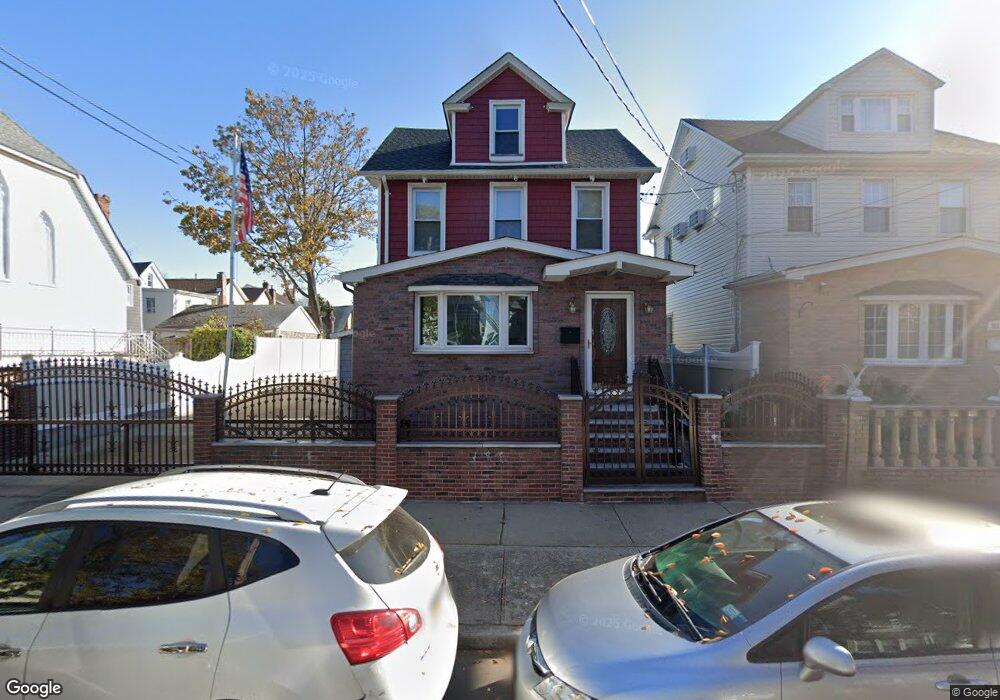
12913 134th St South Ozone Park, NY 11420
South Ozone Park NeighborhoodEstimated Value: $737,000 - $814,000
--
Bed
--
Bath
1,393
Sq Ft
$550/Sq Ft
Est. Value
About This Home
This home is located at 12913 134th St, South Ozone Park, NY 11420 and is currently estimated at $766,166, approximately $550 per square foot. 12913 134th St is a home located in Queens County with nearby schools including Ps 124 Osmond A Church, J.H.S. 226 Virgil I. Grisson, and John Adams High School.
Ownership History
Date
Name
Owned For
Owner Type
Purchase Details
Closed on
Feb 6, 2023
Sold by
Adriana Fabiola Rivas Trustee and Axel Rivas Irrevocable Trust
Bought by
Rivas Axel
Current Estimated Value
Purchase Details
Closed on
Sep 21, 2017
Sold by
Rivas Axel
Bought by
Axel Rivas 2017 Irrevocable Trust
Purchase Details
Closed on
Oct 26, 2007
Sold by
Soogrim Dindial and Soogrim Latchmin
Bought by
Soogrim Deokumar and Soogrim Hemawattie
Home Financials for this Owner
Home Financials are based on the most recent Mortgage that was taken out on this home.
Original Mortgage
$500,000
Interest Rate
6.47%
Purchase Details
Closed on
Jan 24, 1995
Sold by
Persad Sieuranie and Soogrim Dindial
Bought by
Soogrim Dindial
Home Financials for this Owner
Home Financials are based on the most recent Mortgage that was taken out on this home.
Original Mortgage
$108,000
Interest Rate
6.35%
Create a Home Valuation Report for This Property
The Home Valuation Report is an in-depth analysis detailing your home's value as well as a comparison with similar homes in the area
Home Values in the Area
Average Home Value in this Area
Purchase History
| Date | Buyer | Sale Price | Title Company |
|---|---|---|---|
| Rivas Axel | -- | -- | |
| Rivas Axel | -- | -- | |
| Axel Rivas 2017 Irrevocable Trust | -- | -- | |
| Axel Rivas 2017 Irrevocable Trust | -- | -- | |
| Soogrim Deokumar | $625,000 | -- | |
| Soogrim Deokumar | $625,000 | -- | |
| Soogrim Dindial | -- | -- | |
| Soogrim Dindial | -- | -- |
Source: Public Records
Mortgage History
| Date | Status | Borrower | Loan Amount |
|---|---|---|---|
| Previous Owner | Soogrim Deokumar | $500,000 | |
| Previous Owner | Soogrim Dindial | $108,000 |
Source: Public Records
Tax History Compared to Growth
Tax History
| Year | Tax Paid | Tax Assessment Tax Assessment Total Assessment is a certain percentage of the fair market value that is determined by local assessors to be the total taxable value of land and additions on the property. | Land | Improvement |
|---|---|---|---|---|
| 2025 | $5,181 | $27,337 | $6,200 | $21,137 |
| 2024 | $5,181 | $25,795 | $5,729 | $20,066 |
| 2023 | $5,138 | $25,579 | $6,008 | $19,571 |
| 2022 | $4,821 | $42,420 | $10,260 | $32,160 |
| 2021 | $4,795 | $42,840 | $10,260 | $32,580 |
| 2020 | $4,822 | $38,700 | $10,260 | $28,440 |
| 2019 | $4,497 | $38,880 | $10,260 | $28,620 |
| 2018 | $4,345 | $21,316 | $6,317 | $14,999 |
| 2017 | $4,102 | $20,124 | $6,869 | $13,255 |
| 2016 | $3,796 | $20,124 | $6,869 | $13,255 |
| 2015 | $2,290 | $18,984 | $6,895 | $12,089 |
| 2014 | $2,290 | $17,914 | $7,811 | $10,103 |
Source: Public Records
Map
Nearby Homes
- 13410 Sutter Ave
- 129-28 135th Place
- 12940 135th St
- 129-13 135th Place
- 123-45 135th St
- 129-55 134th St
- 135-40 Alwick Rd
- 12321 135th St
- 131-10 134th St
- 120-56 132nd St
- 132-01 131st Ave
- 13121 133rd St
- 137-04 130th Ave
- 120-36 132nd St
- 13013 Sutter Ave
- 13305 120th Ave
- 133-12 133rd St
- 141-08 Rockaway Blvd
- 130-16 130th St
- 13116 140th St
- 12917 134th St
- 12921 134th St
- 13406 Sutter Ave
- 13412 Sutter Ave
- 13402 Sutter Ave
- 12912 135th St
- 12918 135th St
- 13414 Sutter Ave
- 12925 134th St
- 13416 Sutter Ave
- 12922 135th St
- 134-12 Sutter Ave
- 13414 Sutter Ave
- 134-16 Sutter Ave
- 13420 Sutter Ave
- 12926 135th St
- 13320 Sutter Ave
- 12927 134th St
- 12928 135th St