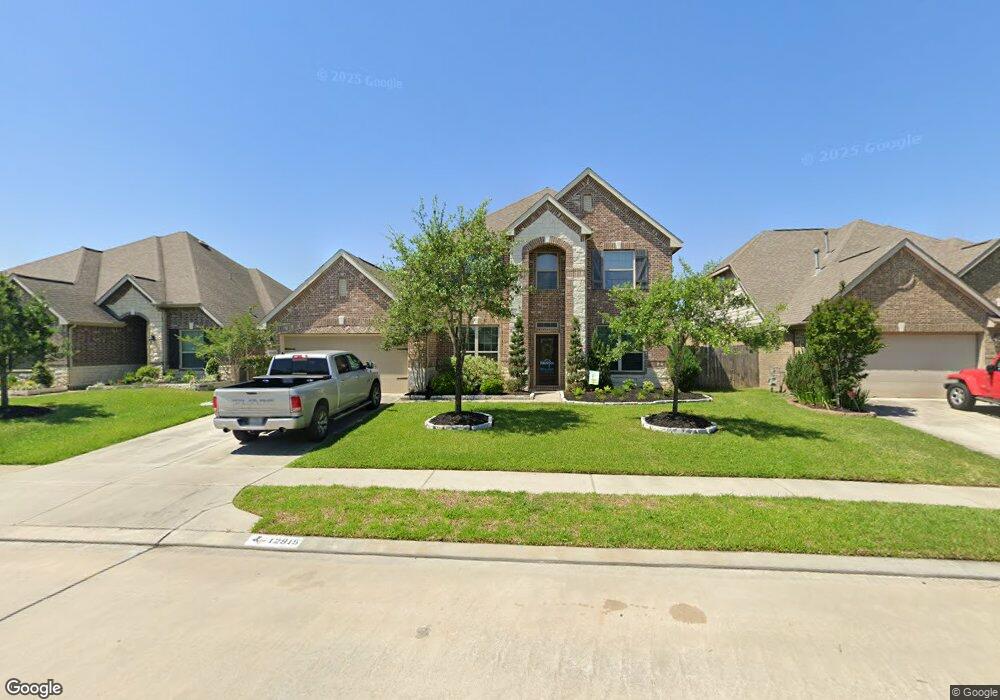
12915 Chatfield Manor Ln Tomball, TX 77377
Northpointe NeighborhoodEstimated Value: $428,689 - $568,000
4
Beds
3
Baths
3,068
Sq Ft
$157/Sq Ft
Est. Value
About This Home
This home is located at 12915 Chatfield Manor Ln, Tomball, TX 77377 and is currently estimated at $482,422, approximately $157 per square foot. 12915 Chatfield Manor Ln is a home located in Harris County with nearby schools including Wildwood Elementary School, Oakcrest Intermediate School, and Tomball Memorial High School.
Ownership History
Date
Name
Owned For
Owner Type
Purchase Details
Closed on
Jun 7, 2013
Sold by
Johnson Timothy Oliver
Bought by
Neve Anthony J and Cruse Tabbetha
Current Estimated Value
Home Financials for this Owner
Home Financials are based on the most recent Mortgage that was taken out on this home.
Original Mortgage
$241,000
Outstanding Balance
$170,821
Interest Rate
3.41%
Mortgage Type
New Conventional
Estimated Equity
$311,601
Purchase Details
Closed on
Feb 27, 2013
Sold by
Lennar Home Of Texas Sales And Marketing
Bought by
Johnson Timothy Oliver
Home Financials for this Owner
Home Financials are based on the most recent Mortgage that was taken out on this home.
Original Mortgage
$237,644
Interest Rate
3.5%
Mortgage Type
FHA
Create a Home Valuation Report for This Property
The Home Valuation Report is an in-depth analysis detailing your home's value as well as a comparison with similar homes in the area
Home Values in the Area
Average Home Value in this Area
Purchase History
| Date | Buyer | Sale Price | Title Company |
|---|---|---|---|
| Neve Anthony J | -- | Stewart Title | |
| Johnson Timothy Oliver | -- | None Available |
Source: Public Records
Mortgage History
| Date | Status | Borrower | Loan Amount |
|---|---|---|---|
| Open | Neve Anthony J | $241,000 | |
| Previous Owner | Johnson Timothy Oliver | $237,644 |
Source: Public Records
Tax History Compared to Growth
Tax History
| Year | Tax Paid | Tax Assessment Tax Assessment Total Assessment is a certain percentage of the fair market value that is determined by local assessors to be the total taxable value of land and additions on the property. | Land | Improvement |
|---|---|---|---|---|
| 2025 | $9,302 | $500,413 | $74,727 | $425,686 |
| 2024 | $9,302 | $445,528 | $69,390 | $376,138 |
| 2023 | $9,302 | $441,792 | $64,052 | $377,740 |
| 2022 | $9,661 | $402,454 | $64,052 | $338,402 |
| 2021 | $9,290 | $303,940 | $44,481 | $259,459 |
| 2020 | $9,180 | $287,901 | $44,481 | $243,420 |
| 2019 | $9,355 | $285,777 | $37,008 | $248,769 |
| 2018 | $3,324 | $273,065 | $37,008 | $236,057 |
| 2017 | $9,128 | $273,065 | $37,008 | $236,057 |
| 2016 | $9,128 | $273,065 | $37,008 | $236,057 |
| 2015 | $8,829 | $273,065 | $37,008 | $236,057 |
| 2014 | $8,829 | $253,944 | $37,008 | $216,936 |
Source: Public Records
Map
Nearby Homes
- 12918 Chatfield Manor Ln
- 18603 Bridle Grove Ct
- 18218 Russett Green Dr
- 18402 Sierra Falls Ct
- 12327 Northpointe Ridge Ln
- 18803 Dusty Rose Ln
- 12902 Frontier Creek Ct
- 18618 Oden Trace Dr
- 13315 Edison Trace Ln
- 18522 Cascade Timbers Ln
- 12719 Rocky Briar Ln
- 19006 Rustling Ridge Ln
- 17623 Edengrove Dr
- 19307 Hillside Pasture Ln
- 20618 Yearling Pasture Ln
- 19243 Palfrey Prairie Trail
- 19219 Palfrey Prairie Trail
- 19326 Palfrey Prairie Trail
- 12802 Mossy Ledge Dr
- 12823 Mossy Ledge Dr
- 12919 Chatfield Manor Ln
- 12911 Chatfield Manor Ln
- 12934 Northwood Glen Ln
- 12938 Northwood Glen Ln
- 12907 Chatfield Manor Ln
- 12923 Chatfield Manor Ln
- 12930 Northwood Glen Ln
- 12942 Northwood Glen Ln
- 12914 Chatfield Manor Ln
- 12910 Chatfield Manor Ln
- 12926 Northwood Glen Ln
- 12946 Northwood Glen Ln
- 12927 Chatfield Manor Ln
- 12903 Chatfield Manor Ln
- 12906 Chatfield Manor Ln
- 12922 Chatfield Manor Ln
- 13002 Northwood Glen Ln
- 12922 Northwood Glen Ln
- 13003 Chatfield Manor Ln
- 12926 Chatfield Manor Ln