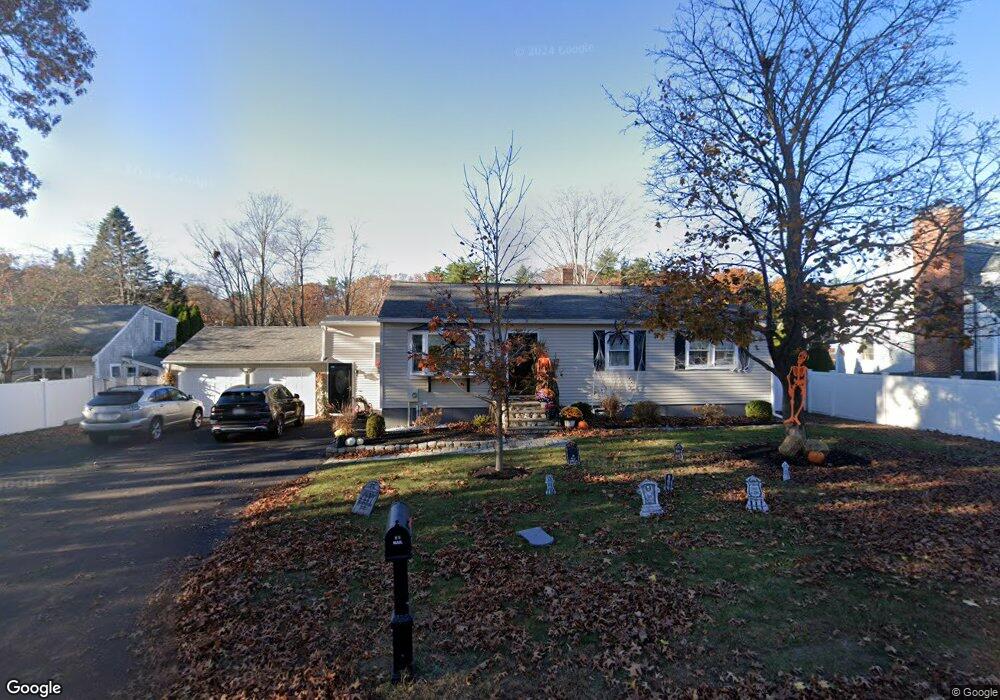
13 Abbott St Merrimac, MA 01860
Estimated Value: $675,505 - $724,000
4
Beds
1
Bath
2,169
Sq Ft
$318/Sq Ft
Est. Value
About This Home
This home is located at 13 Abbott St, Merrimac, MA 01860 and is currently estimated at $690,376, approximately $318 per square foot. 13 Abbott St is a home located in Essex County with nearby schools including Pentucket Regional High School.
Ownership History
Date
Name
Owned For
Owner Type
Purchase Details
Closed on
May 24, 2021
Sold by
Azaliea Realty Llc
Bought by
Roam Realty Llc
Current Estimated Value
Purchase Details
Closed on
May 8, 2006
Sold by
Fowler-Janelli Ellen T
Bought by
Janelli Anthony C
Home Financials for this Owner
Home Financials are based on the most recent Mortgage that was taken out on this home.
Original Mortgage
$210,000
Interest Rate
6.34%
Mortgage Type
Purchase Money Mortgage
Purchase Details
Closed on
Aug 22, 2005
Sold by
Mccarthy James P and Mccarthy Jolanta L
Bought by
Fowler-Janelli Ellen T
Purchase Details
Closed on
Sep 27, 1991
Sold by
Petit Paul C and Petit Mary Ellen
Bought by
Mccarthy James P and Mccarthy Jolanta L
Create a Home Valuation Report for This Property
The Home Valuation Report is an in-depth analysis detailing your home's value as well as a comparison with similar homes in the area
Home Values in the Area
Average Home Value in this Area
Purchase History
| Date | Buyer | Sale Price | Title Company |
|---|---|---|---|
| Roam Realty Llc | -- | None Available | |
| Janelli Anthony C | -- | -- | |
| Fowler-Janelli Ellen T | $385,500 | -- | |
| Mccarthy James P | $130,000 | -- |
Source: Public Records
Mortgage History
| Date | Status | Borrower | Loan Amount |
|---|---|---|---|
| Previous Owner | Mccarthy James P | $245,300 | |
| Previous Owner | Mccarthy James P | $210,000 |
Source: Public Records
Tax History Compared to Growth
Tax History
| Year | Tax Paid | Tax Assessment Tax Assessment Total Assessment is a certain percentage of the fair market value that is determined by local assessors to be the total taxable value of land and additions on the property. | Land | Improvement |
|---|---|---|---|---|
| 2025 | $7,184 | $542,200 | $294,800 | $247,400 |
| 2024 | $7,066 | $523,400 | $278,400 | $245,000 |
| 2023 | $6,793 | $459,900 | $235,900 | $224,000 |
| 2022 | $6,590 | $403,300 | $190,000 | $213,300 |
| 2021 | $6,209 | $380,900 | $173,600 | $207,300 |
| 2020 | $5,668 | $380,900 | $173,600 | $207,300 |
| 2019 | $5,712 | $361,300 | $150,700 | $210,600 |
| 2018 | $5,540 | $351,500 | $140,900 | $210,600 |
| 2017 | $5,154 | $315,400 | $117,900 | $197,500 |
| 2016 | $5,026 | $311,000 | $117,900 | $193,100 |
| 2015 | $4,914 | $302,400 | $117,900 | $184,500 |
| 2014 | $4,805 | $302,400 | $117,900 | $184,500 |
Source: Public Records
Map
Nearby Homes