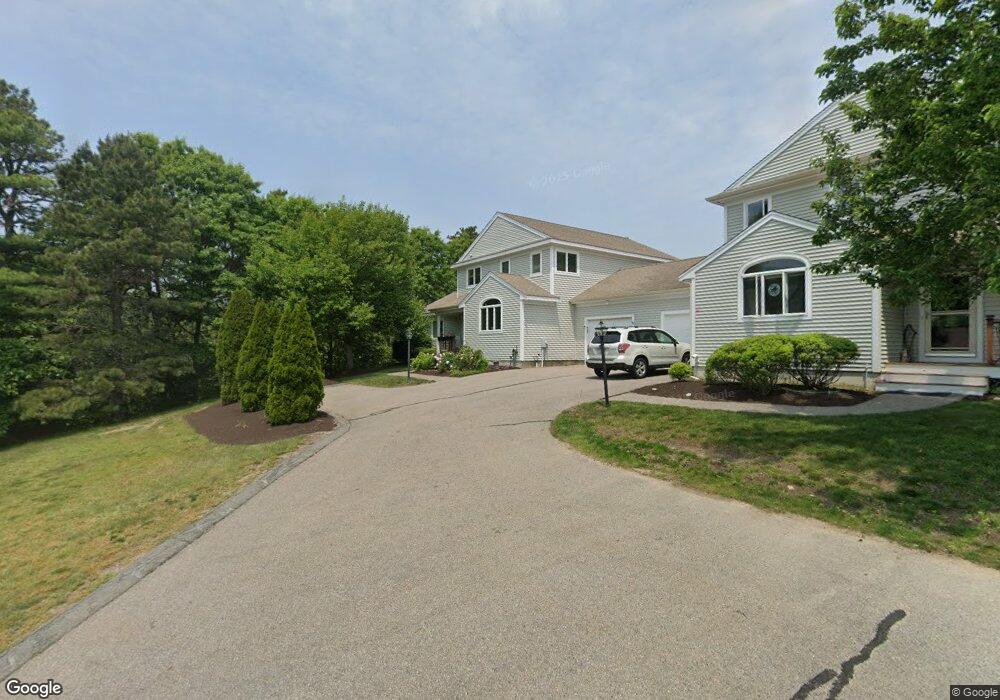
13 Aspen Rd Bourne, MA 02532
Estimated Value: $582,787 - $772,000
2
Beds
2
Baths
2,048
Sq Ft
$322/Sq Ft
Est. Value
About This Home
This home is located at 13 Aspen Rd, Bourne, MA 02532 and is currently estimated at $658,447, approximately $321 per square foot. 13 Aspen Rd is a home located in Barnstable County with nearby schools including Bourne High School, Bridgeview Montessori School, and New Testament Christian School.
Ownership History
Date
Name
Owned For
Owner Type
Purchase Details
Closed on
Dec 9, 2020
Sold by
Marquis Sharren T and Marquis James T
Bought by
Sharren T Marquis Ret
Current Estimated Value
Purchase Details
Closed on
Sep 28, 2017
Sold by
Resources Real Estate
Bought by
Marquis Sharren T and Marquis James T
Home Financials for this Owner
Home Financials are based on the most recent Mortgage that was taken out on this home.
Original Mortgage
$240,000
Interest Rate
3.89%
Mortgage Type
New Conventional
Purchase Details
Closed on
Jan 13, 2015
Sold by
Priestly Donald H
Bought by
Resources Real Estate
Purchase Details
Closed on
Dec 14, 2007
Sold by
Herring Run Condo Corp
Bought by
Priestly Donald H
Purchase Details
Closed on
Feb 25, 1993
Sold by
Prince Michael J and Oconnell Paul R
Bought by
Priestly Donald H and Walther David F
Create a Home Valuation Report for This Property
The Home Valuation Report is an in-depth analysis detailing your home's value as well as a comparison with similar homes in the area
Home Values in the Area
Average Home Value in this Area
Purchase History
| Date | Buyer | Sale Price | Title Company |
|---|---|---|---|
| Sharren T Marquis Ret | -- | None Available | |
| Marquis Sharren T | $389,500 | -- | |
| Resources Real Estate | -- | -- | |
| Priestly Donald H | -- | -- | |
| Priestly Donald H | $95,000 | -- |
Source: Public Records
Mortgage History
| Date | Status | Borrower | Loan Amount |
|---|---|---|---|
| Previous Owner | Marquis Sharren T | $240,000 |
Source: Public Records
Tax History Compared to Growth
Tax History
| Year | Tax Paid | Tax Assessment Tax Assessment Total Assessment is a certain percentage of the fair market value that is determined by local assessors to be the total taxable value of land and additions on the property. | Land | Improvement |
|---|---|---|---|---|
| 2025 | $4,114 | $526,800 | $0 | $526,800 |
| 2024 | $3,912 | $487,800 | $0 | $487,800 |
| 2023 | $3,843 | $436,200 | $0 | $436,200 |
| 2022 | $3,763 | $372,900 | $0 | $372,900 |
| 2021 | $3,901 | $362,200 | $0 | $362,200 |
| 2020 | $3,835 | $357,100 | $0 | $357,100 |
| 2019 | $3,673 | $349,500 | $0 | $349,500 |
| 2018 | $3,615 | $343,000 | $0 | $343,000 |
| 2017 | $3,467 | $336,600 | $0 | $336,600 |
| 2016 | $3,004 | $295,700 | $0 | $295,700 |
| 2015 | $2,643 | $262,500 | $0 | $262,500 |
Source: Public Records
Map
Nearby Homes
- 2 Dogwood Rd
- 4 Dogwood Rd Unit 4
- 4 Dogwood Rd Unit H
- 2 Dogwood Rd Unit 2
- 4 Bittersweet Ln Unit 4
- 6 Brigantine Passage Dr
- 6 Louis Ave
- 215 Roxy Cahoon Rd
- 21 Hillside Rd
- 18 Heather Hill Rd
- 33 Buzzards Bay Ave
- 4 Fieldwood Dr
- 4 Fieldwood Dr
- 18 Ocean Pines Dr Unit A
- 18 Ocean Pines Dr Unit B
- 16 Ocean Pines Dr Unit B
- 51 Commonwealth Ave
- 51 Commonwealth Ave
- 20 Fieldwood Dr
- 0 State Rd