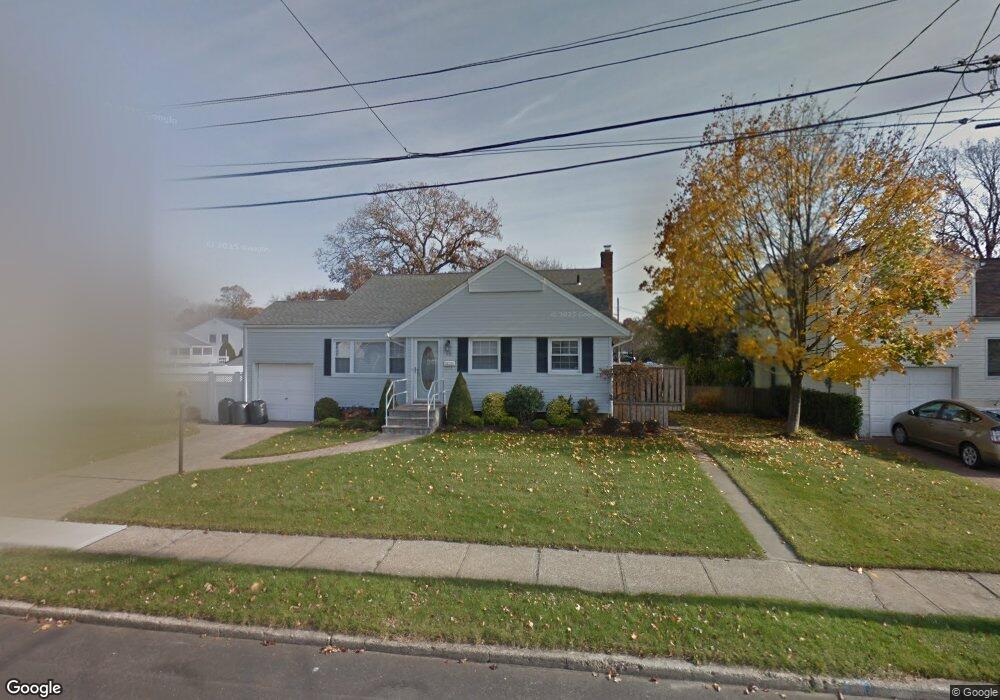
13 Byrd St Massapequa Park, NY 11762
Estimated Value: $707,022 - $755,000
--
Bed
2
Baths
1,103
Sq Ft
$663/Sq Ft
Est. Value
About This Home
This home is located at 13 Byrd St, Massapequa Park, NY 11762 and is currently estimated at $731,011, approximately $662 per square foot. 13 Byrd St is a home located in Nassau County with nearby schools including Albany Avenue Elementary School, Weldon E. Howitt Middle School, and Farmingdale Senior High School.
Ownership History
Date
Name
Owned For
Owner Type
Purchase Details
Closed on
Jun 21, 2018
Sold by
Bart Mivchael and Bart Michele
Bought by
Bart Matthew
Current Estimated Value
Home Financials for this Owner
Home Financials are based on the most recent Mortgage that was taken out on this home.
Original Mortgage
$300,000
Outstanding Balance
$260,031
Interest Rate
4.6%
Mortgage Type
New Conventional
Estimated Equity
$470,980
Purchase Details
Closed on
Oct 25, 2012
Sold by
Mconville Joseph and Mconville Van Gorden
Bought by
Fackovec Bernadette A
Create a Home Valuation Report for This Property
The Home Valuation Report is an in-depth analysis detailing your home's value as well as a comparison with similar homes in the area
Home Values in the Area
Average Home Value in this Area
Purchase History
| Date | Buyer | Sale Price | Title Company |
|---|---|---|---|
| Bart Matthew | $450,000 | None Available | |
| Fackovec Bernadette A | $295,000 | -- |
Source: Public Records
Mortgage History
| Date | Status | Borrower | Loan Amount |
|---|---|---|---|
| Open | Bart Matthew | $300,000 |
Source: Public Records
Tax History Compared to Growth
Tax History
| Year | Tax Paid | Tax Assessment Tax Assessment Total Assessment is a certain percentage of the fair market value that is determined by local assessors to be the total taxable value of land and additions on the property. | Land | Improvement |
|---|---|---|---|---|
| 2025 | $12,678 | $475 | $202 | $273 |
| 2024 | $3,242 | $475 | $202 | $273 |
| 2023 | $12,238 | $469 | $202 | $267 |
| 2022 | $12,238 | $469 | $202 | $267 |
| 2021 | $12,189 | $453 | $195 | $258 |
| 2020 | $12,009 | $657 | $410 | $247 |
| 2019 | $3,544 | $842 | $525 | $317 |
| 2018 | $7,871 | $842 | $0 | $0 |
| 2017 | $7,871 | $842 | $525 | $317 |
| 2016 | $11,088 | $842 | $525 | $317 |
| 2015 | $2,843 | $842 | $525 | $317 |
| 2014 | $2,843 | $842 | $525 | $317 |
| 2013 | $2,562 | $811 | $525 | $286 |
Source: Public Records
Map
Nearby Homes