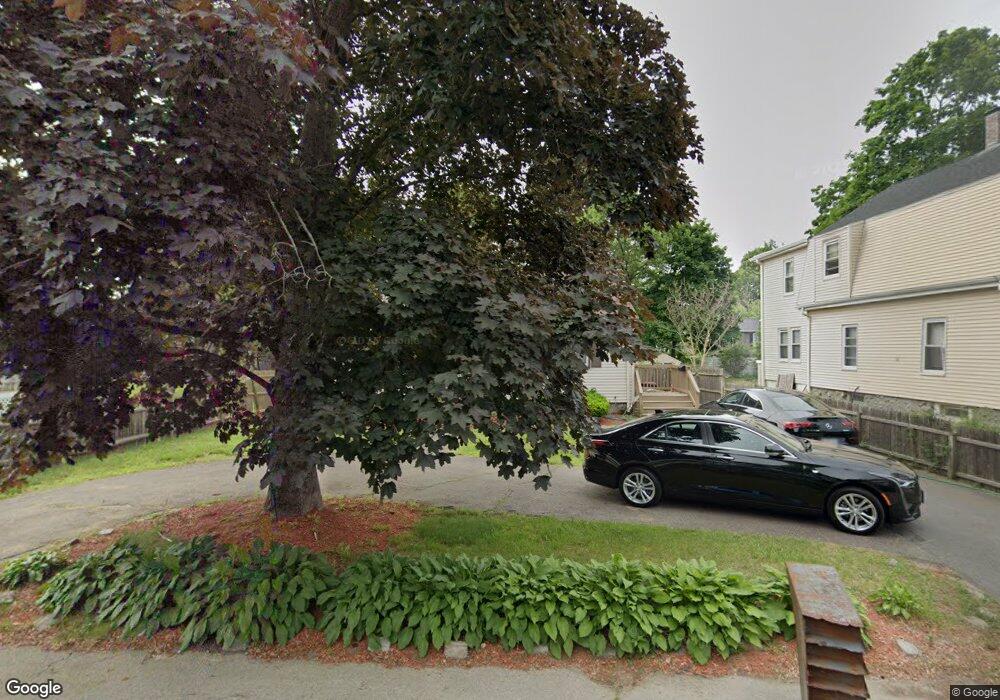
13 East Ave Brockton, MA 02302
Campello NeighborhoodEstimated Value: $458,000 - $510,729
4
Beds
2
Baths
1,504
Sq Ft
$322/Sq Ft
Est. Value
About This Home
This home is located at 13 East Ave, Brockton, MA 02302 and is currently estimated at $484,682, approximately $322 per square foot. 13 East Ave is a home located in Plymouth County with nearby schools including Davis K-8 School, John F. Kennedy Elementary School, and South Middle School.
Ownership History
Date
Name
Owned For
Owner Type
Purchase Details
Closed on
May 29, 1998
Sold by
Butler Joseph C and Butler Robin G
Bought by
Ellis Mark K and Ellis Gail D
Current Estimated Value
Purchase Details
Closed on
Aug 31, 1990
Sold by
Skerritt George E
Bought by
Butler Joseph C
Create a Home Valuation Report for This Property
The Home Valuation Report is an in-depth analysis detailing your home's value as well as a comparison with similar homes in the area
Home Values in the Area
Average Home Value in this Area
Purchase History
| Date | Buyer | Sale Price | Title Company |
|---|---|---|---|
| Ellis Mark K | $116,500 | -- | |
| Butler Joseph C | $112,900 | -- |
Source: Public Records
Mortgage History
| Date | Status | Borrower | Loan Amount |
|---|---|---|---|
| Open | Butler Joseph C | $51,500 | |
| Open | Butler Joseph C | $236,000 | |
| Closed | Butler Joseph C | $193,800 |
Source: Public Records
Tax History Compared to Growth
Tax History
| Year | Tax Paid | Tax Assessment Tax Assessment Total Assessment is a certain percentage of the fair market value that is determined by local assessors to be the total taxable value of land and additions on the property. | Land | Improvement |
|---|---|---|---|---|
| 2025 | $5,039 | $416,100 | $156,400 | $259,700 |
| 2024 | $4,950 | $411,800 | $156,400 | $255,400 |
| 2023 | $4,668 | $359,600 | $106,500 | $253,100 |
| 2022 | $4,730 | $338,600 | $96,800 | $241,800 |
| 2021 | $4,267 | $294,300 | $88,700 | $205,600 |
| 2020 | $4,430 | $292,400 | $78,300 | $214,100 |
| 2019 | $4,298 | $276,600 | $74,300 | $202,300 |
| 2018 | $3,970 | $247,200 | $74,300 | $172,900 |
| 2017 | $3,709 | $230,400 | $74,300 | $156,100 |
| 2016 | $3,470 | $199,900 | $70,900 | $129,000 |
| 2015 | $3,200 | $176,300 | $70,900 | $105,400 |
| 2014 | $3,253 | $179,400 | $70,900 | $108,500 |
Source: Public Records
Map
Nearby Homes