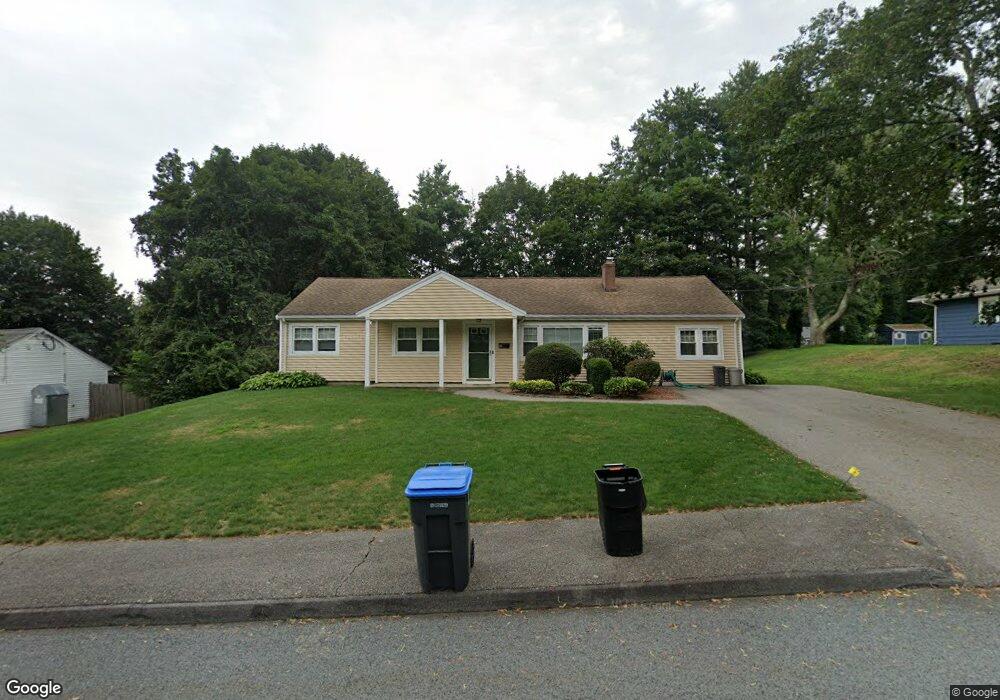
13 Emerson St Natick, MA 01760
Estimated Value: $892,584 - $1,077,000
3
Beds
2
Baths
1,980
Sq Ft
$486/Sq Ft
Est. Value
About This Home
This home is located at 13 Emerson St, Natick, MA 01760 and is currently estimated at $962,896, approximately $486 per square foot. 13 Emerson St is a home located in Middlesex County with nearby schools including Natick High School, Bennett-Hemenway (Ben-Hem) Elementary School, and Wilson Middle School.
Ownership History
Date
Name
Owned For
Owner Type
Purchase Details
Closed on
Dec 28, 2023
Sold by
Ngan Alfred K and Ngan Grace M
Bought by
Ngan Ft and Ngan
Current Estimated Value
Purchase Details
Closed on
Jul 31, 1998
Sold by
Feldman Franklin P and Feldman Paula
Bought by
Ngan Alfred K and Ngan Grace Mei
Home Financials for this Owner
Home Financials are based on the most recent Mortgage that was taken out on this home.
Original Mortgage
$166,275
Interest Rate
6.92%
Mortgage Type
Purchase Money Mortgage
Create a Home Valuation Report for This Property
The Home Valuation Report is an in-depth analysis detailing your home's value as well as a comparison with similar homes in the area
Home Values in the Area
Average Home Value in this Area
Purchase History
| Date | Buyer | Sale Price | Title Company |
|---|---|---|---|
| Ngan Ft | -- | None Available | |
| Ngan Alfred K | $184,750 | -- |
Source: Public Records
Mortgage History
| Date | Status | Borrower | Loan Amount |
|---|---|---|---|
| Previous Owner | Ngan Alfred K | $150,000 | |
| Previous Owner | Ngan Alfred K | $25,000 | |
| Previous Owner | Ngan Alfred K | $166,275 | |
| Previous Owner | Ngan Alfred K | $109,000 |
Source: Public Records
Tax History Compared to Growth
Tax History
| Year | Tax Paid | Tax Assessment Tax Assessment Total Assessment is a certain percentage of the fair market value that is determined by local assessors to be the total taxable value of land and additions on the property. | Land | Improvement |
|---|---|---|---|---|
| 2025 | $8,844 | $739,500 | $461,300 | $278,200 |
| 2024 | $8,567 | $698,800 | $435,700 | $263,100 |
| 2023 | $8,330 | $659,000 | $409,000 | $250,000 |
| 2022 | $8,103 | $607,400 | $372,300 | $235,100 |
| 2021 | $7,899 | $572,400 | $351,900 | $220,500 |
| 2020 | $7,582 | $557,100 | $336,600 | $220,500 |
| 2019 | $7,081 | $557,100 | $336,600 | $220,500 |
| 2018 | $6,955 | $521,700 | $306,000 | $215,700 |
| 2017 | $6,841 | $484,300 | $272,500 | $211,800 |
| 2016 | $4,809 | $354,400 | $257,500 | $96,900 |
| 2015 | $4,772 | $345,300 | $257,500 | $87,800 |
Source: Public Records
Map
Nearby Homes