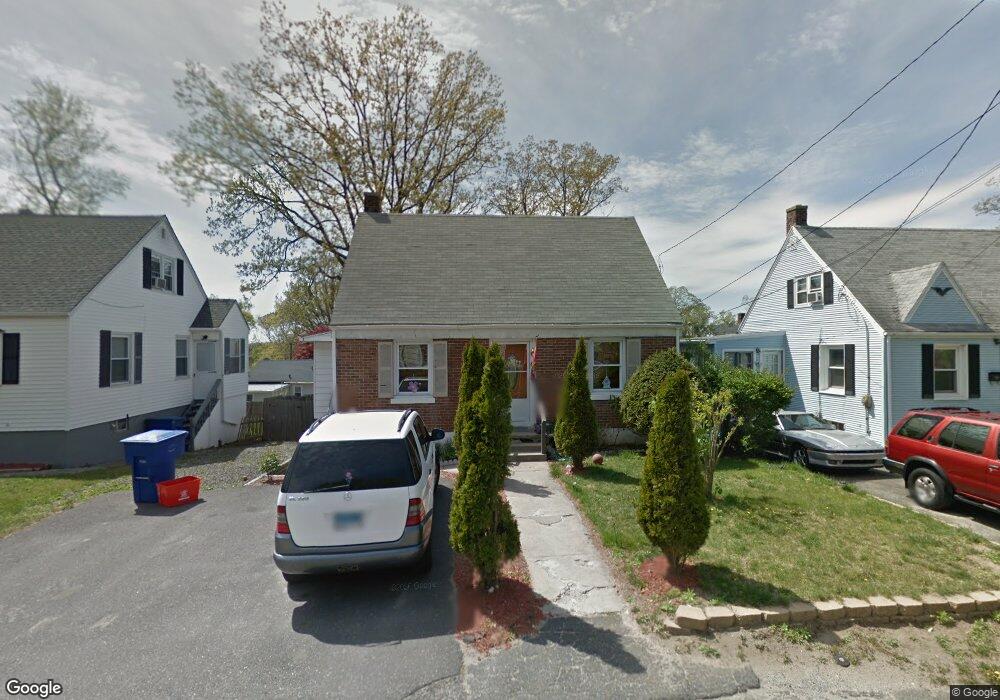
13 Houston St Waterbury, CT 06704
North End District NeighborhoodEstimated Value: $163,000 - $276,000
2
Beds
1
Bath
1,080
Sq Ft
$219/Sq Ft
Est. Value
About This Home
This home is located at 13 Houston St, Waterbury, CT 06704 and is currently estimated at $235,990, approximately $218 per square foot. 13 Houston St is a home located in New Haven County with nearby schools including F. J. Kingsbury School, North End Middle School, and Wilby High School.
Ownership History
Date
Name
Owned For
Owner Type
Purchase Details
Closed on
Mar 5, 2025
Sold by
Burgos Elizabeth
Bought by
Elizabeth Burgos T and Elizabeth Burgos
Current Estimated Value
Purchase Details
Closed on
Apr 14, 2010
Sold by
Department Of Housing & Urban Dev
Bought by
Burgos Elizabeth
Home Financials for this Owner
Home Financials are based on the most recent Mortgage that was taken out on this home.
Original Mortgage
$70,587
Interest Rate
4.97%
Mortgage Type
Purchase Money Mortgage
Purchase Details
Closed on
Jan 15, 2010
Sold by
Midfirst Bk
Bought by
Department Of Housing & Urban Dev
Purchase Details
Closed on
Dec 11, 2006
Sold by
Eldridge Glenn and Eldridge Robin
Bought by
Rosado Omayra I
Purchase Details
Closed on
Sep 9, 2003
Sold by
Trepiccione Elpidio and Trepiccione Michael
Bought by
Eldridge Glenn and Eldridge Robin
Create a Home Valuation Report for This Property
The Home Valuation Report is an in-depth analysis detailing your home's value as well as a comparison with similar homes in the area
Home Values in the Area
Average Home Value in this Area
Purchase History
| Date | Buyer | Sale Price | Title Company |
|---|---|---|---|
| Elizabeth Burgos T | -- | None Available | |
| Elizabeth Burgos T | -- | None Available | |
| Burgos Elizabeth | $68,000 | -- | |
| Burgos Elizabeth | $68,000 | -- | |
| Department Of Housing & Urban Dev | -- | -- | |
| Department Of Housing & Urban Dev | -- | -- | |
| Rosado Omayra I | $140,000 | -- | |
| Rosado Omayra I | $140,000 | -- | |
| Eldridge Glenn | $75,000 | -- | |
| Eldridge Glenn | $75,000 | -- |
Source: Public Records
Mortgage History
| Date | Status | Borrower | Loan Amount |
|---|---|---|---|
| Previous Owner | Eldridge Glenn | $70,587 |
Source: Public Records
Tax History Compared to Growth
Tax History
| Year | Tax Paid | Tax Assessment Tax Assessment Total Assessment is a certain percentage of the fair market value that is determined by local assessors to be the total taxable value of land and additions on the property. | Land | Improvement |
|---|---|---|---|---|
| 2025 | $4,496 | $99,960 | $18,200 | $81,760 |
| 2024 | $4,942 | $99,960 | $18,200 | $81,760 |
| 2023 | $5,417 | $99,960 | $18,200 | $81,760 |
| 2022 | $3,614 | $60,020 | $18,230 | $41,790 |
| 2021 | $3,614 | $60,020 | $18,230 | $41,790 |
| 2020 | $3,614 | $60,020 | $18,230 | $41,790 |
| 2019 | $3,614 | $60,020 | $18,230 | $41,790 |
| 2018 | $3,614 | $60,020 | $18,230 | $41,790 |
| 2017 | $3,927 | $65,220 | $18,230 | $46,990 |
| 2016 | $3,927 | $65,220 | $18,230 | $46,990 |
| 2015 | $3,797 | $65,220 | $18,230 | $46,990 |
| 2014 | $3,797 | $65,220 | $18,230 | $46,990 |
Source: Public Records
Map
Nearby Homes