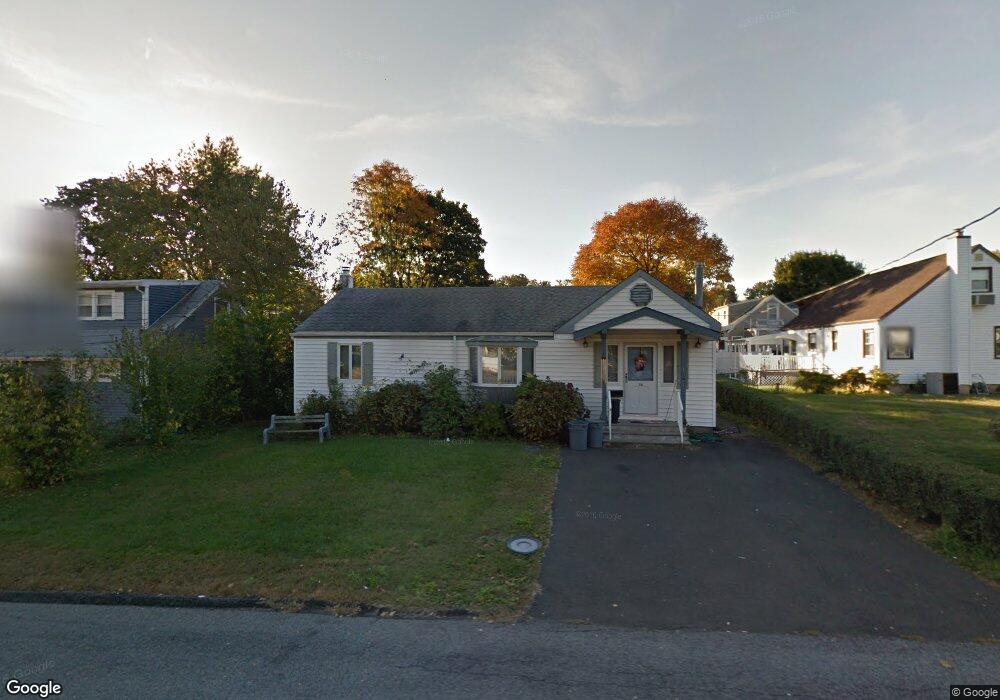
13 Wenzel Ln Stony Point, NY 10980
Estimated Value: $444,888 - $543,000
2
Beds
1
Bath
976
Sq Ft
$495/Sq Ft
Est. Value
About This Home
This home is located at 13 Wenzel Ln, Stony Point, NY 10980 and is currently estimated at $482,722, approximately $494 per square foot. 13 Wenzel Ln is a home located in Rockland County with nearby schools including James A. Farley Middle School, Stony Point Elementary School, and Fieldstone Secondary School.
Ownership History
Date
Name
Owned For
Owner Type
Purchase Details
Closed on
Dec 2, 2024
Sold by
Cecilia M O Connor Asset Protection Trus
Bought by
Roff Kerry A
Current Estimated Value
Purchase Details
Closed on
Jan 18, 2022
Sold by
Oconnor Cecilia M
Bought by
Oconnor Asset Protection Trust
Purchase Details
Closed on
Sep 27, 2002
Sold by
Murphy Anna M and Oconnor Cecilia M
Bought by
Oconnor Cecilia M
Create a Home Valuation Report for This Property
The Home Valuation Report is an in-depth analysis detailing your home's value as well as a comparison with similar homes in the area
Home Values in the Area
Average Home Value in this Area
Purchase History
| Date | Buyer | Sale Price | Title Company |
|---|---|---|---|
| Roff Kerry A | -- | None Available | |
| Roff Kerry A | -- | None Available | |
| Oconnor Asset Protection Trust | -- | None Available | |
| Oconnor Asset Protection Trust | -- | None Available | |
| Oconnor Asset Protection Trust | -- | None Available | |
| Oconnor Cecilia M | -- | -- |
Source: Public Records
Tax History Compared to Growth
Tax History
| Year | Tax Paid | Tax Assessment Tax Assessment Total Assessment is a certain percentage of the fair market value that is determined by local assessors to be the total taxable value of land and additions on the property. | Land | Improvement |
|---|---|---|---|---|
| 2024 | $10,150 | $28,300 | $4,700 | $23,600 |
| 2023 | $10,150 | $28,300 | $4,700 | $23,600 |
| 2022 | $2,600 | $28,300 | $4,700 | $23,600 |
| 2021 | $2,600 | $28,300 | $4,700 | $23,600 |
| 2020 | $3,914 | $28,300 | $4,700 | $23,600 |
| 2019 | $2,351 | $28,300 | $4,700 | $23,600 |
| 2018 | $6,059 | $28,300 | $4,700 | $23,600 |
| 2017 | $5,909 | $28,300 | $4,700 | $23,600 |
| 2016 | $6,124 | $28,300 | $4,700 | $23,600 |
| 2015 | -- | $28,300 | $4,700 | $23,600 |
| 2014 | -- | $28,300 | $4,700 | $23,600 |
Source: Public Records
Map
Nearby Homes