
Seller's Agent in 2024
William Thompson
Keller Williams Elite
(774) 280-5764
1 in this area
228 Total Sales
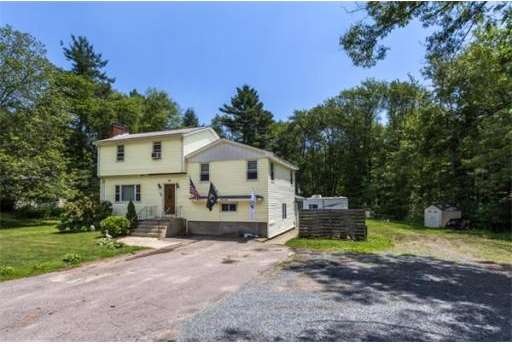
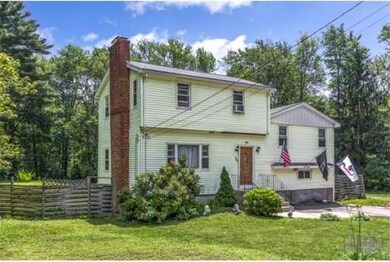
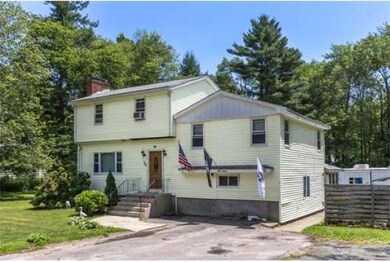


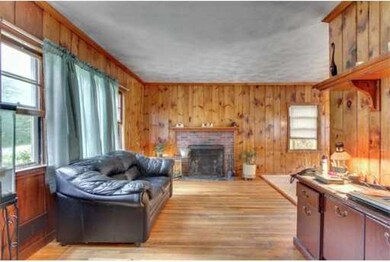
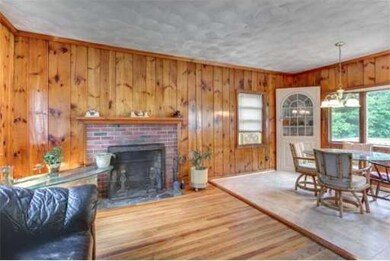
Attention nature lovers. 3.79 Acres! It's like having your own park in the backyard. Ohh, did I mention the property extends all the way to Lake Massapoag!! Hybrid Colonial nearby all the good Sharon has to offer. Move in condition within walking distance of the high school. The home has some newer and some older so bring your creative ideas to take advantage of this great LOCATION close to town, T and major routes.
Home Type
Single Family
Est. Annual Taxes
$10,518
Year Built
1957
Lot Details
0
Listing Details
Interior Features
Exterior Features
Garage/Parking
Utilities
| Date | Type | Sale Price | Title Company |
|---|---|---|---|
| Not Resolvable | $350,000 | -- | |
| Not Resolvable | $350,000 | -- | |
| Deed | $225,000 | -- |
| Date | Status | Loan Amount | Loan Type |
|---|---|---|---|
| Open | $530,000 | Purchase Money Mortgage | |
| Closed | $530,000 | Purchase Money Mortgage | |
| Closed | $230,000 | Stand Alone Refi Refinance Of Original Loan | |
| Closed | $280,000 | Stand Alone Refi Refinance Of Original Loan | |
| Closed | $310,000 | Stand Alone Refi Refinance Of Original Loan | |
| Closed | $312,000 | Stand Alone Refi Refinance Of Original Loan | |
| Closed | $315,000 | New Conventional | |
| Previous Owner | $160,000 | No Value Available | |
| Previous Owner | $165,000 | Purchase Money Mortgage | |
| Previous Owner | $70,000 | No Value Available |
| Date | Event | Price | Change | Sq Ft Price |
|---|---|---|---|---|
| 06/28/2024 06/28/24 | Sold | $730,000 | +4.3% | $347 / Sq Ft |
| 05/28/2024 05/28/24 | Pending | -- | -- | -- |
| 05/22/2024 05/22/24 | For Sale | $699,900 | +100.0% | $332 / Sq Ft |
| 09/17/2013 09/17/13 | Sold | $350,000 | 0.0% | $243 / Sq Ft |
| 07/26/2013 07/26/13 | Pending | -- | -- | -- |
| 07/02/2013 07/02/13 | Off Market | $350,000 | -- | -- |
| 06/27/2013 06/27/13 | For Sale | $355,000 | -- | $247 / Sq Ft |
| Year | Tax Paid | Tax Assessment Tax Assessment Total Assessment is a certain percentage of the fair market value that is determined by local assessors to be the total taxable value of land and additions on the property. | Land | Improvement |
|---|---|---|---|---|
| 2025 | $10,518 | $601,700 | $425,100 | $176,600 |
| 2024 | $9,957 | $566,400 | $391,200 | $175,200 |
| 2023 | $9,745 | $524,200 | $366,500 | $157,700 |
| 2022 | $9,049 | $458,200 | $307,800 | $150,400 |
| 2021 | $8,760 | $428,800 | $282,700 | $146,100 |
| 2020 | $7,978 | $419,900 | $273,800 | $146,100 |
| 2019 | $7,776 | $400,600 | $254,500 | $146,100 |
| 2018 | $7,667 | $395,800 | $249,700 | $146,100 |
| 2017 | $7,465 | $380,500 | $234,400 | $146,100 |
| 2016 | $7,390 | $367,500 | $234,400 | $133,100 |
| 2015 | $6,855 | $337,700 | $216,500 | $121,200 |
| 2014 | $6,673 | $324,700 | $213,200 | $111,500 |
Seller's Agent in 2024
William Thompson
Keller Williams Elite
(774) 280-5764
1 in this area
228 Total Sales
C
Seller's Agent in 2013
Chris Balboni
Keller Williams Elite
(508) 384-8900
9 Total Sales
Source: MLS Property Information Network (MLS PIN)
MLS Number: 71548463
APN: 60 39
Disclaimer: Certain information contained herein is derived from information provided by parties other than Homes.com. All information provided is deemed reliable, but is not guaranteed to be accurate and should be independently verified.
![]() The property listing data and information, or the Images, set forth herein were provided to MLS Property Information Network, Inc. from third party sources, including sellers, lessors and public records, and were compiled by MLS Property Information Network, Inc. The property listing data and information, and the Images, are for the personal, non-commercial use of consumers having a good faith interest in purchasing or leasing listed properties of the type displayed to them and may not be used for any purpose other than to identify prospective properties which such consumers may have a good faith interest in purchasing or leasing. MLS Property Information Network, Inc. and its subscribers disclaim any and all representations and warranties as to the accuracy of the property listing data and information, or as to the accuracy of any of the Images, set forth herein.
The property listing data and information, or the Images, set forth herein were provided to MLS Property Information Network, Inc. from third party sources, including sellers, lessors and public records, and were compiled by MLS Property Information Network, Inc. The property listing data and information, and the Images, are for the personal, non-commercial use of consumers having a good faith interest in purchasing or leasing listed properties of the type displayed to them and may not be used for any purpose other than to identify prospective properties which such consumers may have a good faith interest in purchasing or leasing. MLS Property Information Network, Inc. and its subscribers disclaim any and all representations and warranties as to the accuracy of the property listing data and information, or as to the accuracy of any of the Images, set forth herein.