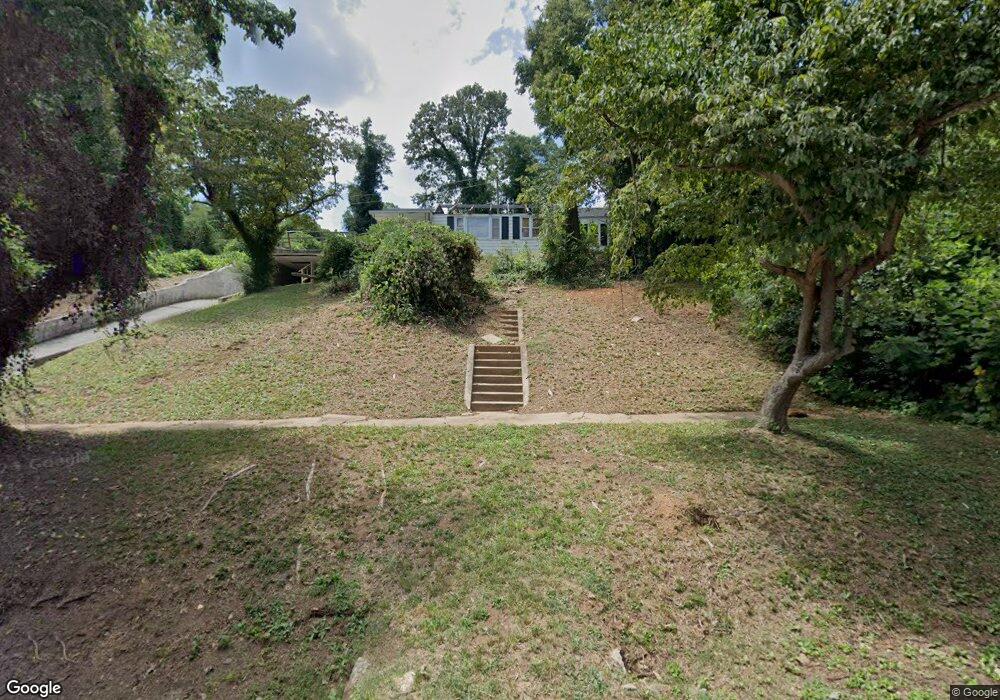
130 Terrace Rd Spartanburg, SC 29301
Park Hills NeighborhoodEstimated Value: $129,000 - $218,000
3
Beds
2
Baths
1,468
Sq Ft
$112/Sq Ft
Est. Value
About This Home
This home is located at 130 Terrace Rd, Spartanburg, SC 29301 and is currently estimated at $164,015, approximately $111 per square foot. 130 Terrace Rd is a home located in Spartanburg County with nearby schools including Spartanburg High School, Spartanburg Preparatory School, and Montessori Academy.
Ownership History
Date
Name
Owned For
Owner Type
Purchase Details
Closed on
Apr 23, 2020
Sold by
Vanbroekhuizen Rene Van
Bought by
Amaya Humberto
Current Estimated Value
Purchase Details
Closed on
May 19, 2009
Sold by
Hsbc Bank Usa National Association
Bought by
Vanbroekhuizen Rene
Purchase Details
Closed on
Oct 22, 2008
Sold by
Mahin Christopher D
Bought by
Hsbc Bank Usa National Association
Purchase Details
Closed on
Apr 17, 2006
Sold by
Deyton Ronnie
Bought by
Mahin Christopher D
Purchase Details
Closed on
Jul 7, 2005
Sold by
Wells Fargo Bank Na
Bought by
Upstate Investments Properties Llc
Purchase Details
Closed on
Mar 28, 2005
Sold by
Wade Jean T and Philson Benny L
Bought by
Wells Fargo Bank Na
Purchase Details
Closed on
Mar 4, 2005
Sold by
Upstate Investment Properties Llc
Bought by
Deyton Ronnie
Purchase Details
Closed on
May 31, 2000
Sold by
Rcw Enterprises Inc
Bought by
Philson Benny L and Wade Jean T
Purchase Details
Closed on
Jun 23, 1999
Sold by
Master In Equity
Bought by
Aames Capital Corp
Create a Home Valuation Report for This Property
The Home Valuation Report is an in-depth analysis detailing your home's value as well as a comparison with similar homes in the area
Home Values in the Area
Average Home Value in this Area
Purchase History
| Date | Buyer | Sale Price | Title Company |
|---|---|---|---|
| Amaya Humberto | $13,750 | None Available | |
| Vanbroekhuizen Rene | $15,500 | -- | |
| Hsbc Bank Usa National Association | -- | -- | |
| Mahin Christopher D | $59,000 | None Available | |
| Upstate Investments Properties Llc | $36,000 | -- | |
| Wells Fargo Bank Na | $74,389 | -- | |
| Deyton Ronnie | $39,000 | -- | |
| Philson Benny L | $75,000 | -- | |
| Aames Capital Corp | $66,700 | -- |
Source: Public Records
Tax History Compared to Growth
Tax History
| Year | Tax Paid | Tax Assessment Tax Assessment Total Assessment is a certain percentage of the fair market value that is determined by local assessors to be the total taxable value of land and additions on the property. | Land | Improvement |
|---|---|---|---|---|
| 2025 | $1,324 | $2,208 | $621 | $1,587 |
| 2024 | $1,324 | $2,208 | $621 | $1,587 |
| 2023 | $1,324 | $2,208 | $621 | $1,587 |
| 2022 | $1,132 | $1,920 | $780 | $1,140 |
| 2021 | $1,131 | $1,920 | $780 | $1,140 |
| 2020 | $1,005 | $1,682 | $683 | $999 |
| 2019 | $1,005 | $1,682 | $683 | $999 |
| 2018 | $1,005 | $1,682 | $683 | $999 |
| 2017 | $855 | $1,359 | $537 | $822 |
| 2016 | $855 | $1,359 | $537 | $822 |
| 2015 | $834 | $1,359 | $537 | $822 |
| 2014 | $829 | $1,359 | $537 | $822 |
Source: Public Records
Map
Nearby Homes
- 127 E Victoria Rd
- 144 E Victoria Rd
- 133 Marlboro Rd
- 121 W Victoria Rd
- 119 W Victoria Rd
- 117 Helen St
- 162 Watkins Ct
- 438 Stevens St
- 309 Willow Oaks Dr
- 125 Westover Dr
- 517 Pennwood Dr
- 220 Willow Oaks Dr
- 483 Pinckney Ct
- 115 Rosemary Rd
- 516 Pennwood Dr
- 439 Zephyr St
- 135 Overbrook Cir
- 114 Brookside Rd
- 365 Amherst Dr
- 290 Hydrick St
- 137 E Victoria Rd
- 153 E Victoria Rd
- 122 Terrace Rd
- 131 E Victoria Rd
- 161 E Victoria Rd
- 135 E Victoria Rd
- 135 E Victoria Rd
- 120 Terrace Rd
- 171 Terrace Rd
- 140 Marlboro Rd
- 138 Terrace Rd
- 165 E Victoria Rd
- 118 Terrace Rd
- 173 Whiteford Rd
- 119 Terrace Rd
- 175 Marlboro Rd
- 140 Terrace Rd
- 177 Marlboro Rd
- 170 Marlboro Rd
- 125 E Victoria Rd