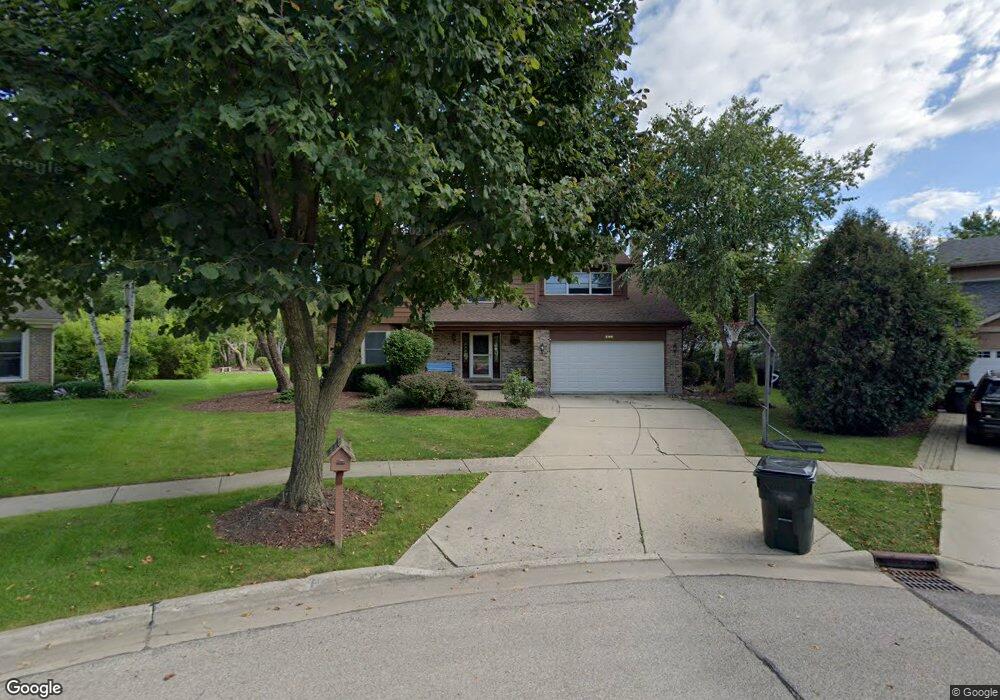
1300 Romeo Ct Libertyville, IL 60048
Interlaken NeighborhoodEstimated Value: $680,408 - $751,000
--
Bed
3
Baths
2,780
Sq Ft
$263/Sq Ft
Est. Value
About This Home
This home is located at 1300 Romeo Ct, Libertyville, IL 60048 and is currently estimated at $731,852, approximately $263 per square foot. 1300 Romeo Ct is a home located in Lake County with nearby schools including Butterfield School, Highland Middle School, and Libertyville High School.
Ownership History
Date
Name
Owned For
Owner Type
Purchase Details
Closed on
Aug 14, 2003
Sold by
Mudd Timothy E and Mudd Kimberlee T
Bought by
Charles Cary R and Miller Charles Marianne
Current Estimated Value
Home Financials for this Owner
Home Financials are based on the most recent Mortgage that was taken out on this home.
Original Mortgage
$276,000
Outstanding Balance
$127,794
Interest Rate
6.33%
Mortgage Type
Purchase Money Mortgage
Estimated Equity
$604,058
Purchase Details
Closed on
Feb 6, 1997
Sold by
Mudd Timothy E and Mudd Kimberly T
Bought by
Mudd Timothy E and Mudd Kimberly T
Purchase Details
Closed on
Jun 26, 1995
Sold by
Seeds Charles E and Seeds Terry L
Bought by
Mudd Timothy and Mudd Kimberly
Home Financials for this Owner
Home Financials are based on the most recent Mortgage that was taken out on this home.
Original Mortgage
$227,600
Interest Rate
7.88%
Create a Home Valuation Report for This Property
The Home Valuation Report is an in-depth analysis detailing your home's value as well as a comparison with similar homes in the area
Home Values in the Area
Average Home Value in this Area
Purchase History
| Date | Buyer | Sale Price | Title Company |
|---|---|---|---|
| Charles Cary R | $466,000 | Chicago Title Insurance Comp | |
| Mudd Timothy E | -- | -- | |
| Mudd Timothy | -- | -- |
Source: Public Records
Mortgage History
| Date | Status | Borrower | Loan Amount |
|---|---|---|---|
| Open | Charles Cary R | $276,000 | |
| Previous Owner | Mudd Timothy | $227,600 | |
| Closed | Charles Cary R | $96,800 |
Source: Public Records
Tax History Compared to Growth
Tax History
| Year | Tax Paid | Tax Assessment Tax Assessment Total Assessment is a certain percentage of the fair market value that is determined by local assessors to be the total taxable value of land and additions on the property. | Land | Improvement |
|---|---|---|---|---|
| 2024 | $13,197 | $186,345 | $61,520 | $124,825 |
| 2023 | $13,441 | $171,873 | $56,742 | $115,131 |
| 2022 | $13,441 | $174,059 | $58,019 | $116,040 |
| 2021 | $12,941 | $170,312 | $56,770 | $113,542 |
| 2020 | $12,454 | $167,449 | $55,816 | $111,633 |
| 2019 | $12,145 | $165,857 | $55,285 | $110,572 |
| 2018 | $12,119 | $181,964 | $55,356 | $126,608 |
| 2017 | $12,747 | $176,219 | $53,608 | $122,611 |
| 2016 | $12,327 | $177,823 | $50,828 | $126,995 |
| 2015 | $13,036 | $166,205 | $47,507 | $118,698 |
| 2014 | $12,364 | $158,104 | $45,504 | $112,600 |
| 2012 | $11,744 | $156,170 | $45,900 | $110,270 |
Source: Public Records
Map
Nearby Homes
- 1338 Trinity Place
- 1708 Park Crest Ct
- 1801 Torrey Pkwy
- 1512 Sunnyview Rd
- 832 Interlaken Ln
- 1917 Halifax St
- 1834 Torrey Pkwy Unit 103
- 1960 Pinehurst Ct
- 1506 Bull Creek Dr
- 694 Parkside Ct
- 178 Brookhill Rd
- 662 Parkside Ct
- 223 Kenloch Ave
- 616 Parkside Ct
- 1935 Lynn Cir
- 619 Parkside Ct
- 1330 W Park Ave
- 212 W Ellis Ave
- 208 W Ellis Ave
- 204 W Ellis Ave