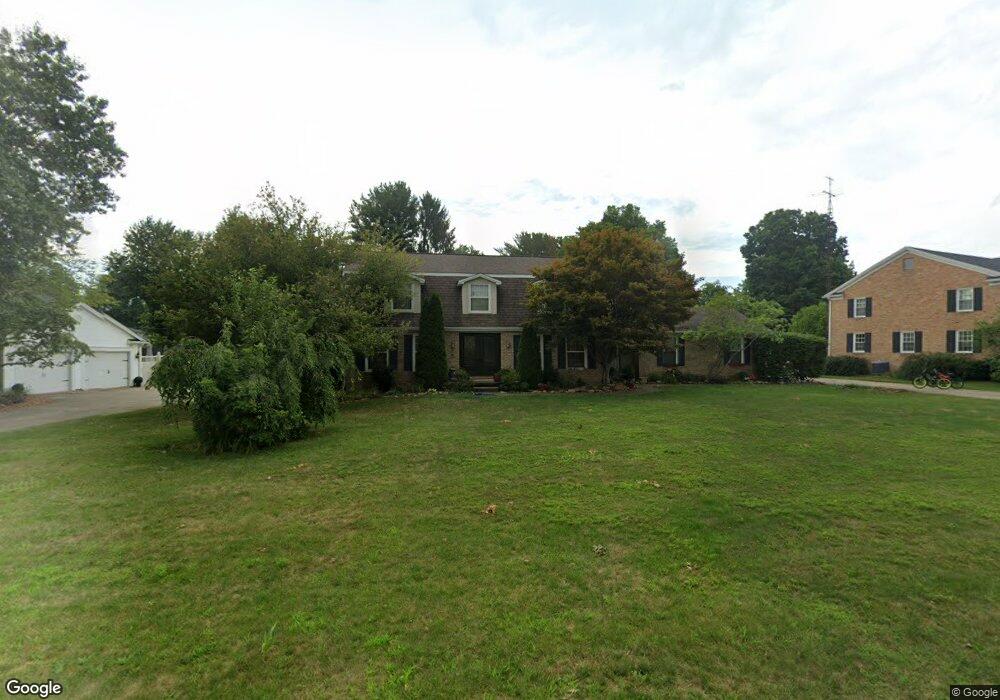
1301 Danbury Rd NW North Canton, OH 44720
Estimated Value: $351,000 - $413,000
5
Beds
3
Baths
2,896
Sq Ft
$129/Sq Ft
Est. Value
About This Home
This home is located at 1301 Danbury Rd NW, North Canton, OH 44720 and is currently estimated at $373,653, approximately $129 per square foot. 1301 Danbury Rd NW is a home located in Stark County with nearby schools including Middlebranch Elementary School, Oakwood Middle School, and GlenOak High School.
Ownership History
Date
Name
Owned For
Owner Type
Purchase Details
Closed on
Jan 20, 2010
Sold by
Fannie Mae
Bought by
Burch Stephanie M
Current Estimated Value
Home Financials for this Owner
Home Financials are based on the most recent Mortgage that was taken out on this home.
Original Mortgage
$144,827
Outstanding Balance
$94,701
Interest Rate
4.87%
Mortgage Type
FHA
Estimated Equity
$278,952
Purchase Details
Closed on
Nov 4, 2009
Sold by
Hillen Paul D
Bought by
Federal National Mortgage Association
Purchase Details
Closed on
Mar 8, 2002
Sold by
Eaglowski Diane E
Bought by
Hillen Paul D and Hillen Nancy C
Home Financials for this Owner
Home Financials are based on the most recent Mortgage that was taken out on this home.
Original Mortgage
$170,000
Interest Rate
7.03%
Mortgage Type
Balloon
Purchase Details
Closed on
Nov 4, 1988
Create a Home Valuation Report for This Property
The Home Valuation Report is an in-depth analysis detailing your home's value as well as a comparison with similar homes in the area
Home Values in the Area
Average Home Value in this Area
Purchase History
| Date | Buyer | Sale Price | Title Company |
|---|---|---|---|
| Burch Stephanie M | $147,500 | None Available | |
| Federal National Mortgage Association | $223,613 | None Available | |
| Hillen Paul D | $190,000 | Mk Title Agency Of Stark Cou | |
| -- | $125,000 | -- |
Source: Public Records
Mortgage History
| Date | Status | Borrower | Loan Amount |
|---|---|---|---|
| Open | Burch Stephanie M | $144,827 | |
| Previous Owner | Hillen Paul D | $170,000 |
Source: Public Records
Tax History Compared to Growth
Tax History
| Year | Tax Paid | Tax Assessment Tax Assessment Total Assessment is a certain percentage of the fair market value that is determined by local assessors to be the total taxable value of land and additions on the property. | Land | Improvement |
|---|---|---|---|---|
| 2025 | -- | $124,920 | $27,970 | $96,950 |
| 2024 | -- | $120,790 | $27,970 | $92,820 |
| 2023 | $3,828 | $82,190 | $18,870 | $63,320 |
| 2022 | $1,923 | $82,190 | $18,870 | $63,320 |
| 2021 | $3,862 | $82,190 | $18,870 | $63,320 |
| 2020 | $3,582 | $69,380 | $16,280 | $53,100 |
| 2019 | $3,552 | $69,380 | $16,280 | $53,100 |
| 2018 | $3,509 | $69,380 | $16,280 | $53,100 |
| 2017 | $3,462 | $62,860 | $14,770 | $48,090 |
| 2016 | $3,471 | $62,860 | $14,770 | $48,090 |
| 2015 | $3,338 | $62,550 | $14,770 | $47,780 |
| 2014 | $1,397 | $62,270 | $14,700 | $47,570 |
| 2013 | $1,656 | $62,270 | $14,700 | $47,570 |
Source: Public Records
Map
Nearby Homes
- 1216 Marquardt Ave NW
- 7455 Brushmore Ave NW
- 1141 Las Olas Blvd NW
- 7272 Ashburton Cir NW
- 2211 Markley St NW
- 1010 Las Olas Blvd NW
- 930 Las Olas Ave NW
- 1236 Glennview St NE
- 1240 Fountain View St NE
- 0 Marquardt Dr NW
- 0 Marquardt Ave
- 1369 Gate House St NE
- 119 Stone Crossing St NE
- Lehigh w/ 3-Car Garage Plan at Fountains at Edgewood
- Powell w/ Finished Basement Plan at Fountains at Edgewood
- Corsica w/ Finished Basement Plan at Fountains at Edgewood
- Roanoke w/ Finished Basement Plan at Fountains at Edgewood
- Cumberland w/ Finished Basement Plan at Fountains at Edgewood
- 1240 7th St NE
- 1020 Pickforde Dr NE
- 1325 Danbury Rd NW
- 1277 Danbury Rd NW
- 1352 Stonington Rd NW
- 1340 Stonington Rd NW
- 1351 Danbury Rd NW
- 1265 Danbury Rd NW
- 1364 Stonington Rd NW
- 1312 Danbury Rd NW
- 1270 Pickett St NW
- 1326 Danbury Rd NW
- 1328 Stonington Rd NW
- 1261 Pickett St NW
- 1344 Danbury Rd NW
- 1373 Danbury Rd NW
- 1253 Danbury Rd NW
- 1378 Stonington Rd NW
- 1266 Danbury Rd NW
- 1362 Danbury Rd NW
- 1367 Stonington Rd NW
- 1256 Danbury Rd NW