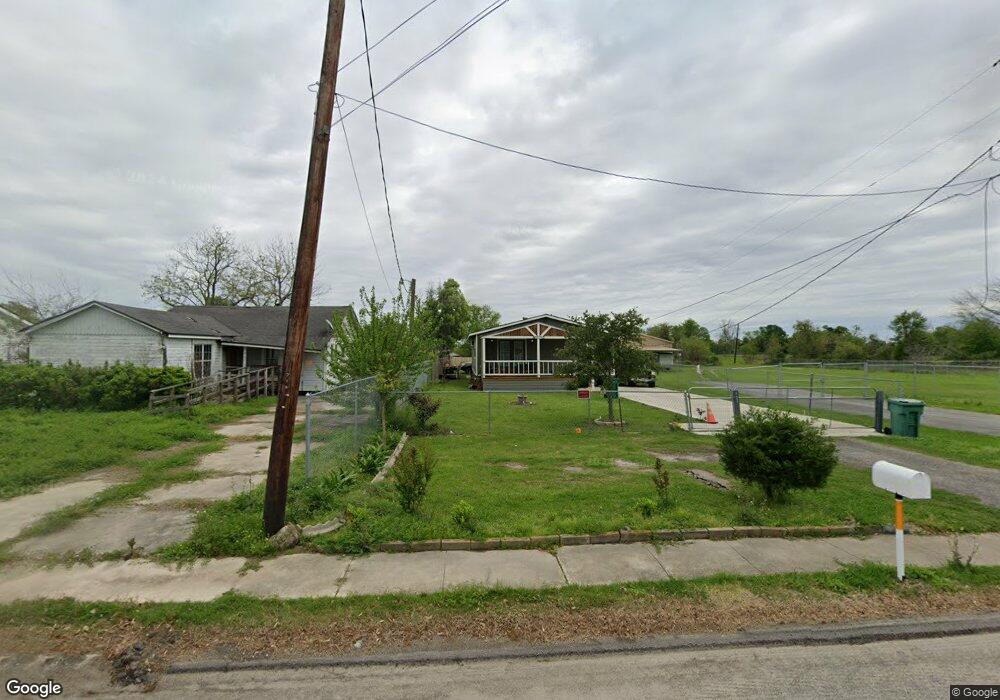
1301 Dupont Dr Orange, TX 77630
East Orange NeighborhoodEstimated Value: $76,000 - $119,777
--
Bed
--
Bath
1,200
Sq Ft
$85/Sq Ft
Est. Value
About This Home
This home is located at 1301 Dupont Dr, Orange, TX 77630 and is currently estimated at $102,444, approximately $85 per square foot. 1301 Dupont Dr is a home located in Orange County with nearby schools including West Orange-Stark Elementary School, West Orange-Stark Middle School, and West Orange-Stark High School.
Ownership History
Date
Name
Owned For
Owner Type
Purchase Details
Closed on
Apr 15, 2021
Sold by
Melgoza Mario
Bought by
Mena Karen Tatiana and Navas Luis Orlando
Current Estimated Value
Purchase Details
Closed on
Dec 3, 2018
Sold by
Robinson William M
Bought by
Salamanca Karen Bonilla and Navas Luis Mena
Home Financials for this Owner
Home Financials are based on the most recent Mortgage that was taken out on this home.
Original Mortgage
$3,500
Interest Rate
4.8%
Mortgage Type
Purchase Money Mortgage
Purchase Details
Closed on
Jun 25, 2018
Sold by
Robinson David
Bought by
Salamanca Karen Bonilla and Navas Luis Mena
Purchase Details
Closed on
May 17, 2018
Sold by
Robinson William M
Bought by
Robinson David J
Purchase Details
Closed on
Mar 21, 2006
Sold by
Sherrill Greg L
Bought by
Robinson Wiliiam M
Purchase Details
Closed on
Mar 26, 1996
Sold by
Unknown Seller
Bought by
Robinson William M
Create a Home Valuation Report for This Property
The Home Valuation Report is an in-depth analysis detailing your home's value as well as a comparison with similar homes in the area
Home Values in the Area
Average Home Value in this Area
Purchase History
| Date | Buyer | Sale Price | Title Company |
|---|---|---|---|
| Mena Karen Tatiana | -- | None Available | |
| Salamanca Karen Bonilla | -- | None Available | |
| Salamanca Karen Bonilla | -- | None Available | |
| Robinson David J | -- | None Available | |
| Robinson Wiliiam M | -- | None Available | |
| Robinson William M | -- | -- |
Source: Public Records
Mortgage History
| Date | Status | Borrower | Loan Amount |
|---|---|---|---|
| Previous Owner | Salamanca Karen Bonilla | $3,500 |
Source: Public Records
Tax History Compared to Growth
Tax History
| Year | Tax Paid | Tax Assessment Tax Assessment Total Assessment is a certain percentage of the fair market value that is determined by local assessors to be the total taxable value of land and additions on the property. | Land | Improvement |
|---|---|---|---|---|
| 2024 | $2,569 | $121,875 | $3,525 | $118,350 |
| 2023 | $2,312 | $102,665 | $3,525 | $99,140 |
| 2022 | $1,246 | $84,955 | $3,525 | $81,430 |
| 2021 | $2,049 | $73,145 | $3,525 | $74,310 |
| 2020 | $1,869 | $66,495 | $3,525 | $62,970 |
| 2019 | $2,000 | $68,715 | $3,525 | $65,190 |
| 2018 | $1,796 | $64,064 | $2,500 | $65,460 |
| 2017 | $950 | $58,240 | $2,500 | $55,740 |
| 2016 | $1,533 | $54,796 | $2,500 | $52,296 |
| 2015 | $1,021 | $54,696 | $2,500 | $52,196 |
| 2014 | $1,021 | $55,763 | $2,500 | $53,263 |
Source: Public Records
Map
Nearby Homes
- 1008 Dupont Dr
- 1601 Georgia Ave
- 607 Dupont Dr
- 710 Levingston St
- 802 Border St
- 906 W Scott St
- 602 Border St
- 412 Market St
- 1621 Western Ave
- 803 Chester St
- 1100 & 1106 Flint St
- 2308 Travis St
- 2404 Smith St
- 208 College St
- 811 Flint St
- 2112 Houston St Unit 2114
- 2112 & 2114 Houston
- 701 Sherrill St
- 2120 Houston St
- 1212 Irving St