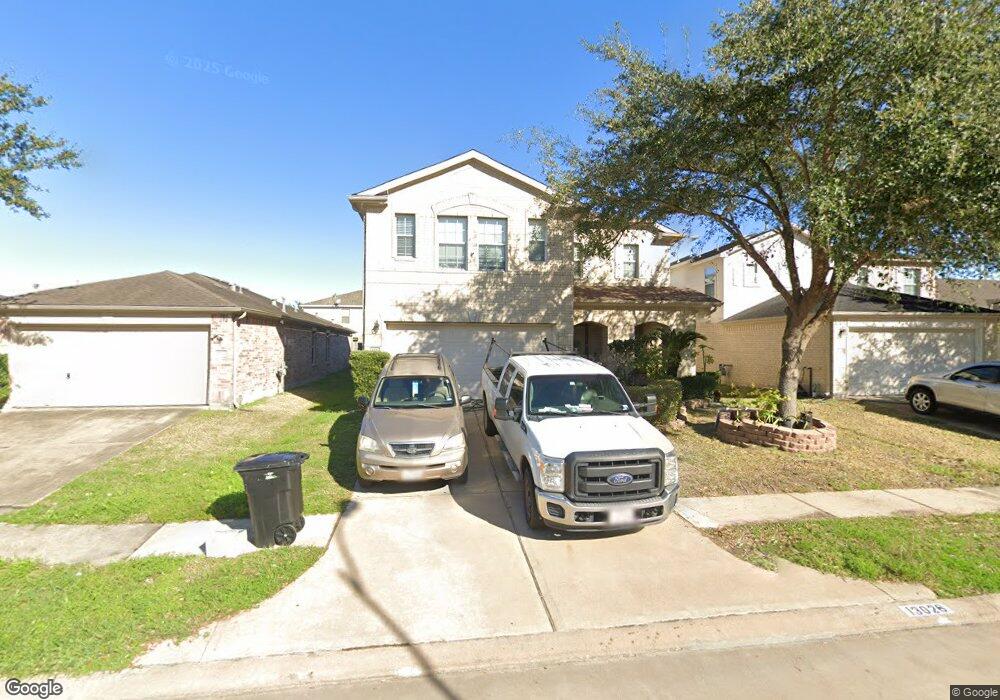
13026 Crescent Manor Ln Houston, TX 77072
Alief NeighborhoodEstimated Value: $299,000 - $330,000
4
Beds
3
Baths
2,940
Sq Ft
$108/Sq Ft
Est. Value
About This Home
This home is located at 13026 Crescent Manor Ln, Houston, TX 77072 and is currently estimated at $317,051, approximately $107 per square foot. 13026 Crescent Manor Ln is a home located in Harris County with nearby schools including Alexander Elementary School, Youngblood Intermediate School, and Holub Middle School.
Ownership History
Date
Name
Owned For
Owner Type
Purchase Details
Closed on
Apr 16, 2015
Sold by
Troung Troney Thang and Troung Troney T
Bought by
Troung Troney Thang
Current Estimated Value
Home Financials for this Owner
Home Financials are based on the most recent Mortgage that was taken out on this home.
Original Mortgage
$129,920
Outstanding Balance
$100,557
Interest Rate
3.89%
Mortgage Type
New Conventional
Estimated Equity
$216,494
Purchase Details
Closed on
Nov 30, 2005
Sold by
Kb Home Lone Star Lp
Bought by
Truong Troney T
Home Financials for this Owner
Home Financials are based on the most recent Mortgage that was taken out on this home.
Original Mortgage
$142,666
Interest Rate
6.12%
Mortgage Type
Fannie Mae Freddie Mac
Create a Home Valuation Report for This Property
The Home Valuation Report is an in-depth analysis detailing your home's value as well as a comparison with similar homes in the area
Home Values in the Area
Average Home Value in this Area
Purchase History
| Date | Buyer | Sale Price | Title Company |
|---|---|---|---|
| Troung Troney Thang | -- | First American Title Ins Co | |
| Truong Troney T | -- | First American Title |
Source: Public Records
Mortgage History
| Date | Status | Borrower | Loan Amount |
|---|---|---|---|
| Open | Troung Troney Thang | $129,920 | |
| Previous Owner | Truong Troney T | $142,666 |
Source: Public Records
Tax History Compared to Growth
Tax History
| Year | Tax Paid | Tax Assessment Tax Assessment Total Assessment is a certain percentage of the fair market value that is determined by local assessors to be the total taxable value of land and additions on the property. | Land | Improvement |
|---|---|---|---|---|
| 2025 | $8,809 | $379,055 | $47,650 | $331,405 |
| 2024 | $8,809 | $379,107 | $47,650 | $331,457 |
| 2023 | $8,809 | $362,080 | $47,650 | $314,430 |
| 2022 | $8,533 | $343,615 | $42,885 | $300,730 |
| 2021 | $6,586 | $262,690 | $35,738 | $226,952 |
| 2020 | $6,784 | $258,837 | $30,973 | $227,864 |
| 2019 | $7,016 | $251,169 | $26,208 | $224,961 |
| 2018 | $2,776 | $208,691 | $26,208 | $182,483 |
| 2017 | $5,809 | $208,691 | $26,208 | $182,483 |
| 2016 | $5,809 | $208,691 | $26,208 | $182,483 |
| 2015 | $4,350 | $193,253 | $26,208 | $167,045 |
| 2014 | $4,350 | $161,045 | $26,208 | $134,837 |
Source: Public Records
Map
Nearby Homes
- 13034 Lima Dr
- 13102 Lima Dr
- 13122 Stratford Skies Ln
- 8427 Brickhaven Ln
- 13426 Sanderford Ln
- 8115 Barnes Ridge Ln
- 8110 Singing Sonnet Ln
- 8042 Montague Manor Ln
- 8910 Beau Monde Dr
- 12722 Yoshino Cherry St
- 13103 Cressida Glen Ln
- 7930 Montague Manor Ln
- 13122 Cressida Glen Ln
- 12712 Plummersville St
- 13047 Lawsons Creek Ln
- 13059 Lawsons Creek Ln
- 13150 Lawsons Creek Ln
- 9219 Benchley Dr
- 0 Bissonnet St Unit 5006520
- 12682 Newbrook Dr
- 13022 Crescent Manor Ln
- 13030 Crescent Manor Ln
- 13030 Crescent Manor Ln Unit 1
- 13018 Crescent Manor Ln
- 13102 Crescent Manor Ln
- 13023 Dawn Hollow Ln
- 13027 Dawn Hollow Ln
- 13019 Dawn Hollow Ln
- 13103 Dawn Hollow Ln
- 13014 Crescent Manor Ln
- 13015 Dawn Hollow Ln
- 13031 Crescent Manor Ln
- 13027 Crescent Manor Ln
- 13107 Dawn Hollow Ln
- 13023 Crescent Manor Ln
- 8503 Bloom Mist Ct
- 13011 Dawn Hollow Ln
- 13010 Crescent Manor Ln
- 13110 Crescent Manor Ln
- 13019 Crescent Manor Ln