Estimated Value: $474,000 - $657,000
2
Beds
2
Baths
1,306
Sq Ft
$436/Sq Ft
Est. Value
About This Home
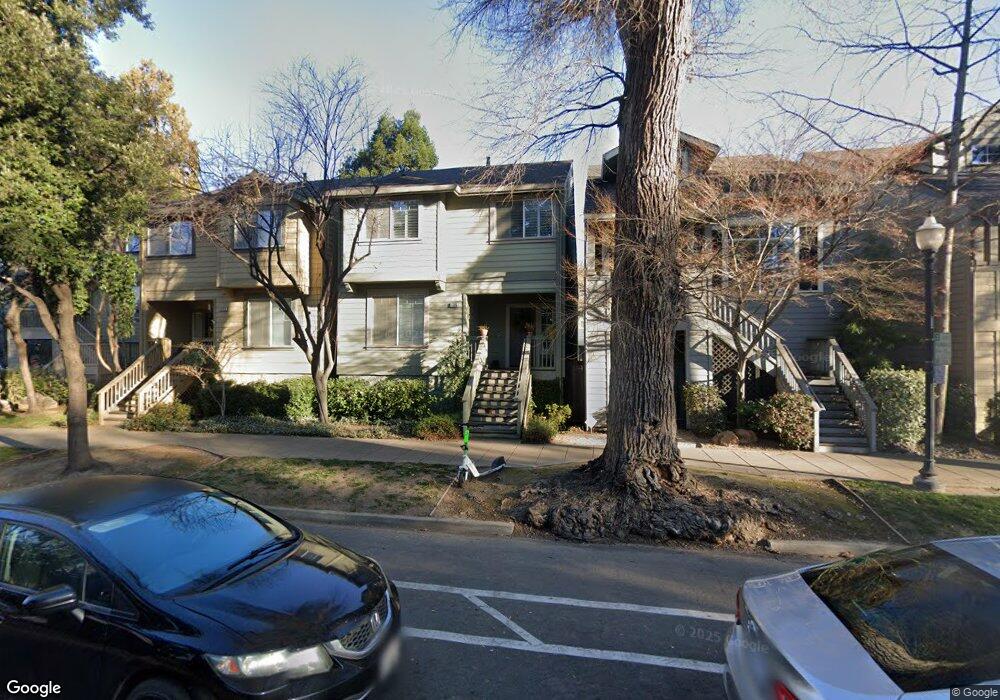
This home is located at 1305 Q St, Sacramento, CA 95811 and is currently estimated at $569,549, approximately $436 per square foot. 1305 Q St is a home located in Sacramento County with nearby schools including William Land Elementary School, Miwok Middle School, and C. K. McClatchy High.
Ownership History
Date
Name
Owned For
Owner Type
Purchase Details
Closed on
Oct 21, 2021
Sold by
Rielli Alison M
Bought by
Rielli Alison M and Rielli Living Trust
Current Estimated Value
Purchase Details
Closed on
Aug 27, 2002
Sold by
Shasta/Downtown Sacramento Single Family
Bought by
Rielli Alison M
Home Financials for this Owner
Home Financials are based on the most recent Mortgage that was taken out on this home.
Original Mortgage
$84,054
Outstanding Balance
$35,240
Interest Rate
6.29%
Estimated Equity
$534,309
Create a Home Valuation Report for This Property
The Home Valuation Report is an in-depth analysis detailing your home's value as well as a comparison with similar homes in the area
Home Values in the Area
Average Home Value in this Area
Purchase History
| Date | Buyer | Sale Price | Title Company |
|---|---|---|---|
| Rielli Alison M | -- | None Available | |
| Rielli Alison M | -- | None Available | |
| Rielli Alison M | $99,000 | Stewart Title |
Source: Public Records
Mortgage History
| Date | Status | Borrower | Loan Amount |
|---|---|---|---|
| Open | Rielli Alison M | $84,054 |
Source: Public Records
Tax History Compared to Growth
Tax History
| Year | Tax Paid | Tax Assessment Tax Assessment Total Assessment is a certain percentage of the fair market value that is determined by local assessors to be the total taxable value of land and additions on the property. | Land | Improvement |
|---|---|---|---|---|
| 2025 | $1,901 | $143,200 | $57,921 | $85,279 |
| 2024 | $1,901 | $140,393 | $56,786 | $83,607 |
| 2023 | $1,857 | $137,641 | $55,673 | $81,968 |
| 2022 | $1,825 | $134,943 | $54,582 | $80,361 |
| 2021 | $1,666 | $132,298 | $53,512 | $78,786 |
| 2020 | $1,673 | $130,943 | $52,964 | $77,979 |
| 2019 | $1,638 | $128,376 | $51,926 | $76,450 |
| 2018 | $1,595 | $125,859 | $50,908 | $74,951 |
| 2017 | $1,571 | $123,392 | $49,910 | $73,482 |
| 2016 | $1,302 | $105,684 | $42,747 | $62,937 |
| 2015 | $1,210 | $97,856 | $39,581 | $58,275 |
| 2014 | $1,190 | $96,887 | $39,189 | $57,698 |
Source: Public Records
Map
Nearby Homes