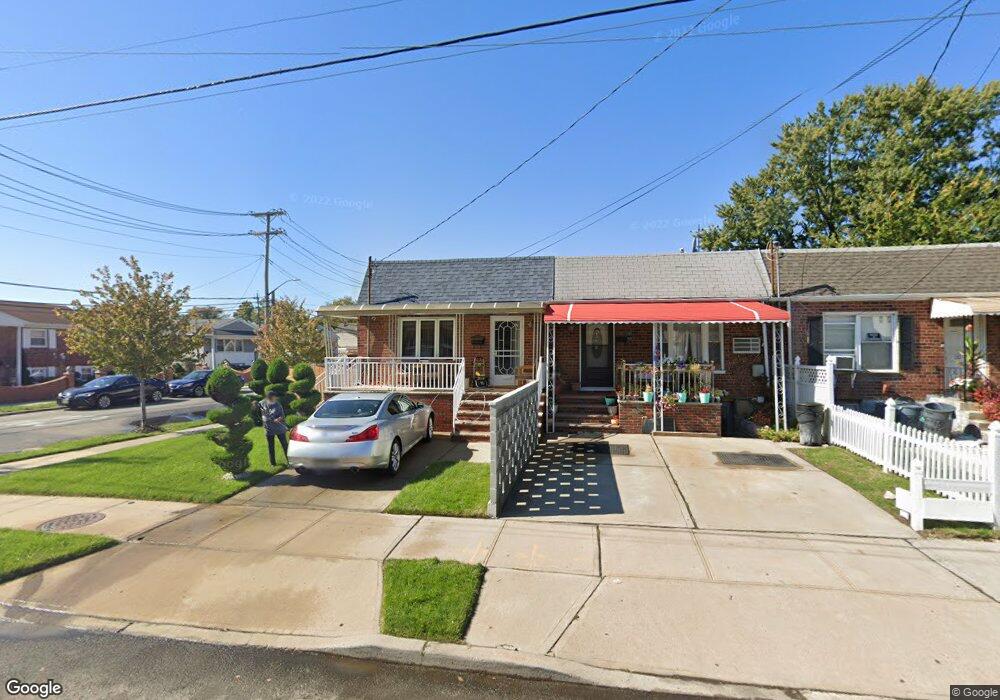
13052 Springfield Blvd Springfield Gardens, NY 11413
Saint Albans NeighborhoodEstimated Value: $546,829 - $640,000
--
Bed
--
Bath
820
Sq Ft
$728/Sq Ft
Est. Value
About This Home
This home is located at 13052 Springfield Blvd, Springfield Gardens, NY 11413 and is currently estimated at $596,957, approximately $727 per square foot. 13052 Springfield Blvd is a home located in Queens County with nearby schools including P.S. 15 Jackie Robinson, Is 59 Springfield Gardens, and Success Academy Springfield Gardens.
Ownership History
Date
Name
Owned For
Owner Type
Purchase Details
Closed on
Aug 19, 2002
Sold by
Hud
Bought by
Murray Jaqueline A
Current Estimated Value
Home Financials for this Owner
Home Financials are based on the most recent Mortgage that was taken out on this home.
Original Mortgage
$184,300
Interest Rate
6.03%
Purchase Details
Closed on
May 31, 1996
Sold by
Holy Assembly Of Jesus The Christ Inc
Bought by
Hiddekel Church Of God Inc
Home Financials for this Owner
Home Financials are based on the most recent Mortgage that was taken out on this home.
Original Mortgage
$103,550
Interest Rate
7.97%
Mortgage Type
FHA
Purchase Details
Closed on
May 29, 1996
Sold by
Citibank Na
Bought by
Holy Assembly Of Jesus Christ Inc
Home Financials for this Owner
Home Financials are based on the most recent Mortgage that was taken out on this home.
Original Mortgage
$103,550
Interest Rate
7.97%
Mortgage Type
FHA
Create a Home Valuation Report for This Property
The Home Valuation Report is an in-depth analysis detailing your home's value as well as a comparison with similar homes in the area
Home Values in the Area
Average Home Value in this Area
Purchase History
| Date | Buyer | Sale Price | Title Company |
|---|---|---|---|
| Murray Jaqueline A | -- | -- | |
| Hiddekel Church Of God Inc | $93,500 | -- | |
| Holy Assembly Of Jesus Christ Inc | $100,000 | -- |
Source: Public Records
Mortgage History
| Date | Status | Borrower | Loan Amount |
|---|---|---|---|
| Previous Owner | Murray Jaqueline A | $184,300 | |
| Previous Owner | Hiddekel Church Of God Inc | $103,550 |
Source: Public Records
Tax History Compared to Growth
Tax History
| Year | Tax Paid | Tax Assessment Tax Assessment Total Assessment is a certain percentage of the fair market value that is determined by local assessors to be the total taxable value of land and additions on the property. | Land | Improvement |
|---|---|---|---|---|
| 2025 | $4,477 | $23,688 | $9,118 | $14,570 |
| 2024 | $4,489 | $23,688 | $9,327 | $14,361 |
| 2023 | $4,441 | $23,510 | $9,831 | $13,679 |
| 2022 | $4,141 | $27,720 | $11,340 | $16,380 |
| 2021 | $4,107 | $22,980 | $11,340 | $11,640 |
| 2020 | $3,882 | $19,740 | $11,340 | $8,400 |
| 2019 | $4,163 | $21,300 | $11,340 | $9,960 |
| 2018 | $3,956 | $20,866 | $10,687 | $10,179 |
| 2017 | $3,758 | $19,905 | $10,086 | $9,819 |
| 2016 | $3,498 | $19,905 | $10,086 | $9,819 |
| 2015 | $2,045 | $17,971 | $10,483 | $7,488 |
| 2014 | $2,045 | $17,971 | $12,580 | $5,391 |
Source: Public Records
Map
Nearby Homes
- 13049 217th St
- 130-25 217th St
- 13024 Springfield Blvd
- 19332 Williamson Ave
- 192-17 Williamson Ave
- 194-01 Nashville Blvd
- 19401 Nashville Blvd
- 122-52 Springfield Blvd
- 19115 Williamson Ave
- 21924 130th Dr
- 21827 130th Ave
- 21917 132nd Rd
- 12512 Nepton St
- 194-09 122nd Ave
- 130-45 220th St
- 121-17 196th St
- 121-11 195th St
- 21931 133rd Ave
- 121-9 195th St
- 22014 130th Ave
- 13050 Springfield Blvd
- 13048 Springfield Blvd
- 12423 193rd St
- 13046 Springfield Blvd
- 13044 Springfield Blvd
- 12432 193rd St
- 12419 193rd St
- 13042 Springfield Blvd
- 130-40 Springfield Blvd
- 130-40 Springfield Blvd Unit 1st Fl
- 13040 Springfield Blvd
- 12424 193rd St
- 12415 193rd St
- 13110 Springfield Blvd
- 13038 Springfield Blvd
- 191-40 Pineville Ln
- 124-11 193rd St
- 19140 Pineville Ln
- 13036 Springfield Blvd
- 13043 Springfield Blvd