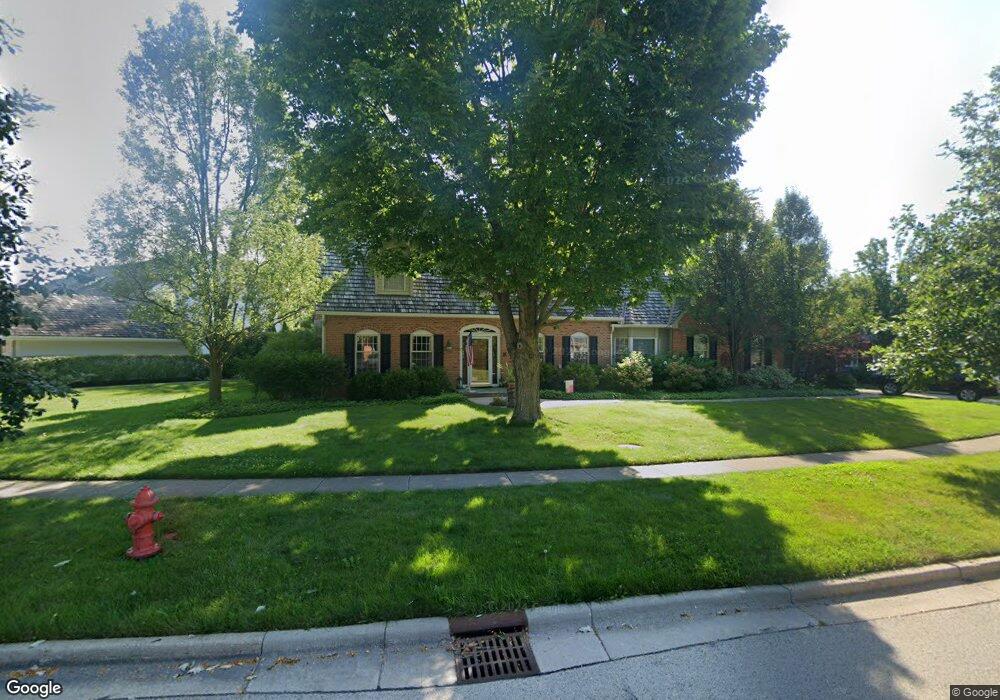
1309 Kristin Dr Libertyville, IL 60048
Interlaken NeighborhoodEstimated Value: $757,228 - $941,000
--
Bed
3
Baths
3,184
Sq Ft
$265/Sq Ft
Est. Value
About This Home
This home is located at 1309 Kristin Dr, Libertyville, IL 60048 and is currently estimated at $843,057, approximately $264 per square foot. 1309 Kristin Dr is a home located in Lake County with nearby schools including Butterfield School, Highland Middle School, and Libertyville High School.
Ownership History
Date
Name
Owned For
Owner Type
Purchase Details
Closed on
Feb 6, 2015
Sold by
Banks Timothy C and Banks Susan L
Bought by
Banks Susan L and The Susan L Banks 2012 Revocab
Current Estimated Value
Purchase Details
Closed on
Jun 17, 1999
Sold by
Norrgren Bengt and Norrgren Birgitta
Bought by
Banks Timothy C and Banks Susan L
Home Financials for this Owner
Home Financials are based on the most recent Mortgage that was taken out on this home.
Original Mortgage
$350,000
Outstanding Balance
$92,839
Interest Rate
7.12%
Estimated Equity
$750,218
Purchase Details
Closed on
Nov 7, 1996
Sold by
Moynihan James Joseph and Moynihan Dawn B
Bought by
Norrgren Bengt and Norrgren Birgitta
Home Financials for this Owner
Home Financials are based on the most recent Mortgage that was taken out on this home.
Original Mortgage
$449,000
Interest Rate
7.66%
Create a Home Valuation Report for This Property
The Home Valuation Report is an in-depth analysis detailing your home's value as well as a comparison with similar homes in the area
Home Values in the Area
Average Home Value in this Area
Purchase History
| Date | Buyer | Sale Price | Title Company |
|---|---|---|---|
| Banks Susan L | -- | None Available | |
| Banks Timothy C | $313,333 | Ticor Title | |
| Norrgren Bengt | $449,000 | -- |
Source: Public Records
Mortgage History
| Date | Status | Borrower | Loan Amount |
|---|---|---|---|
| Open | Banks Timothy C | $350,000 | |
| Previous Owner | Norrgren Bengt | $449,000 |
Source: Public Records
Tax History Compared to Growth
Tax History
| Year | Tax Paid | Tax Assessment Tax Assessment Total Assessment is a certain percentage of the fair market value that is determined by local assessors to be the total taxable value of land and additions on the property. | Land | Improvement |
|---|---|---|---|---|
| 2024 | $14,454 | $203,267 | $64,554 | $138,713 |
| 2023 | $14,023 | $187,481 | $59,541 | $127,940 |
| 2022 | $14,023 | $181,335 | $57,229 | $124,106 |
| 2021 | $13,501 | $177,431 | $55,997 | $121,434 |
| 2020 | $14,007 | $187,579 | $59,200 | $128,379 |
| 2019 | $13,659 | $185,795 | $58,637 | $127,158 |
| 2018 | $14,546 | $204,005 | $57,194 | $146,811 |
| 2017 | $14,346 | $197,564 | $55,388 | $142,176 |
| 2016 | $13,876 | $187,317 | $52,515 | $134,802 |
| 2015 | $13,758 | $175,079 | $49,084 | $125,995 |
| 2014 | $13,432 | $167,698 | $47,014 | $120,684 |
| 2012 | $12,654 | $169,153 | $47,422 | $121,731 |
Source: Public Records
Map
Nearby Homes
- 1338 Trinity Place
- 1708 Park Crest Ct
- 1512 Sunnyview Rd
- 1801 Torrey Pkwy
- 832 Interlaken Ln
- 1834 Torrey Pkwy Unit 103
- 1917 Halifax St
- 694 Parkside Ct
- 1960 Pinehurst Ct
- 662 Parkside Ct
- 178 Brookhill Rd
- 1506 Bull Creek Dr
- 616 Parkside Ct
- 1935 Lynn Cir
- 619 Parkside Ct
- 223 Kenloch Ave
- 212 W Ellis Ave
- 208 W Ellis Ave
- 204 W Ellis Ave
- 420 W Cook Ave
- 1305 Kristin Dr
- 1311 Kristin Dr Unit 2
- 1301 Kristin Dr
- 1315 Kristin Dr
- 1310 Kristin Dr
- 1308 Kristin Dr
- 1306 Kristin Dr
- 1312 Kristin Dr
- 1302 Kristin Dr
- 1219 Loyola Dr
- 1217 Loyola Dr
- 1329 Saint William Dr
- 1300 Kristin Dr
- 1314 Kristin Dr
- 1215 Loyola Dr
- 1319 Saint William Dr
- 1317 Saint William Dr
- 1321 Saint William Dr
- 1305 Saint William Dr
- 1220 Kristin Dr