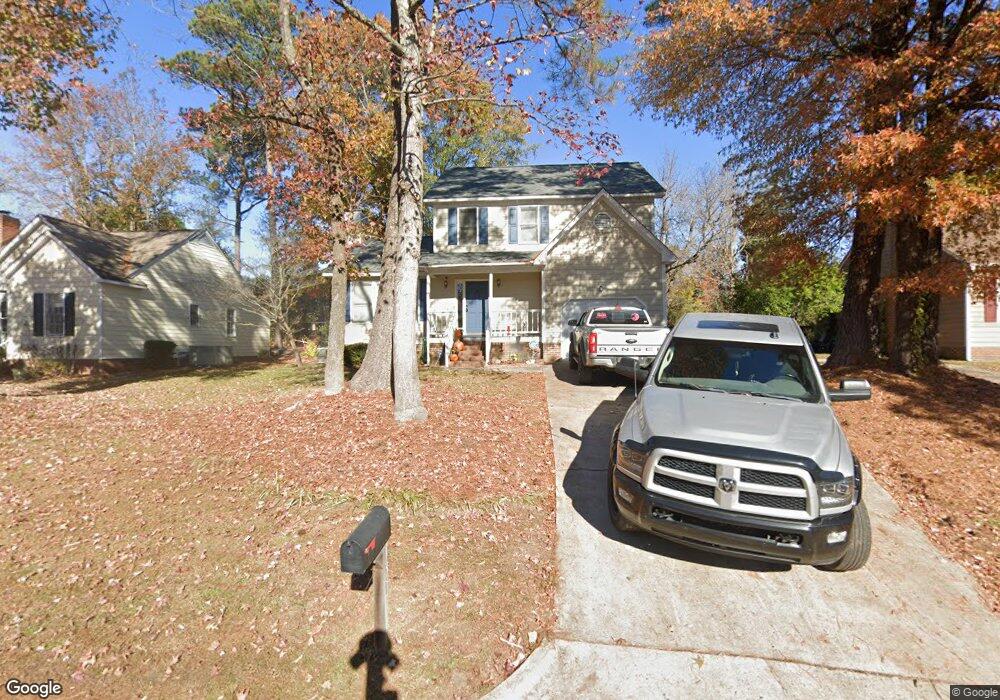
131 Autumn Ridge Dr Knightdale, NC 27545
Estimated Value: $331,000 - $348,888
3
Beds
3
Baths
1,780
Sq Ft
$190/Sq Ft
Est. Value
About This Home
This home is located at 131 Autumn Ridge Dr, Knightdale, NC 27545 and is currently estimated at $338,972, approximately $190 per square foot. 131 Autumn Ridge Dr is a home located in Wake County with nearby schools including Lockhart Elementary School, Neuse River Middle School, and Knightdale High.
Ownership History
Date
Name
Owned For
Owner Type
Purchase Details
Closed on
Apr 10, 2006
Sold by
Christiansen Peter R and Christiansen Amanda F
Bought by
Sutton Michael D and Sutton Blanche Yvette
Current Estimated Value
Home Financials for this Owner
Home Financials are based on the most recent Mortgage that was taken out on this home.
Original Mortgage
$134,910
Outstanding Balance
$76,945
Interest Rate
6.23%
Mortgage Type
Purchase Money Mortgage
Estimated Equity
$262,027
Purchase Details
Closed on
Oct 31, 2001
Sold by
Bos Robert and Bos Alexandria Marie
Bought by
Christiansen Peter R and Christiansen Amanda F
Home Financials for this Owner
Home Financials are based on the most recent Mortgage that was taken out on this home.
Original Mortgage
$108,720
Interest Rate
8.8%
Create a Home Valuation Report for This Property
The Home Valuation Report is an in-depth analysis detailing your home's value as well as a comparison with similar homes in the area
Home Values in the Area
Average Home Value in this Area
Purchase History
| Date | Buyer | Sale Price | Title Company |
|---|---|---|---|
| Sutton Michael D | $150,000 | None Available | |
| Christiansen Peter R | $136,000 | -- |
Source: Public Records
Mortgage History
| Date | Status | Borrower | Loan Amount |
|---|---|---|---|
| Open | Sutton Michael D | $134,910 | |
| Previous Owner | Christiansen Peter R | $108,720 | |
| Closed | Christiansen Peter R | $27,180 |
Source: Public Records
Tax History Compared to Growth
Tax History
| Year | Tax Paid | Tax Assessment Tax Assessment Total Assessment is a certain percentage of the fair market value that is determined by local assessors to be the total taxable value of land and additions on the property. | Land | Improvement |
|---|---|---|---|---|
| 2025 | $3,481 | $361,617 | $80,000 | $281,617 |
| 2024 | $3,486 | $363,454 | $80,000 | $283,454 |
| 2023 | $2,460 | $220,458 | $44,000 | $176,458 |
| 2022 | $2,378 | $220,458 | $44,000 | $176,458 |
| 2021 | $2,269 | $220,458 | $44,000 | $176,458 |
| 2020 | $2,269 | $220,458 | $44,000 | $176,458 |
| 2019 | $1,925 | $165,521 | $30,000 | $135,521 |
| 2018 | $1,815 | $165,521 | $30,000 | $135,521 |
| 2017 | $1,750 | $165,521 | $30,000 | $135,521 |
| 2016 | $1,726 | $165,521 | $30,000 | $135,521 |
| 2015 | $1,750 | $165,651 | $30,000 | $135,651 |
| 2014 | $1,690 | $165,651 | $30,000 | $135,651 |
Source: Public Records
Map
Nearby Homes
- 603 Pine Forest Trail
- 208 George Pine Way Unit 110
- 1400 Irving Hill Dr
- 7912 Flatrock Park Dr
- 117 Stanway Dr
- 413 Laurens Way
- 506 Sternwheel Way
- 1442 Jay Rd
- 1452 Jay Rd
- 1500 Wader Cir
- 1456 Jay Rd
- 1516 Wader Cir
- 1463 Jay Rd
- 1448 Jay Rd
- 1700 Goldfinch Perch Ln
- 1580 Goldfinch Perch Ln
- 444 Haywood Glen Dr
- 1512 Wader Cir
- 1466 Jay Rd
- 1504 Wader Cir
- 129 Autumn Ridge Dr
- 133 Autumn Ridge Dr
- 127 Autumn Ridge Dr
- 135 Autumn Ridge Dr
- 132 Autumn Ridge Dr
- 130 Autumn Ridge Dr
- 4023 Village Park Dr
- 144 Autumn Ridge Dr
- 125 Autumn Ridge Dr
- 128 Autumn Ridge Dr
- 137 Autumn Ridge Dr
- 4005 Village Park Dr
- 4021 Village Park Dr
- 4019 Village Park Dr
- 4031 Village Park Dr
- 4027 Village Park Dr
- 110 Autumn Ridge Dr
- 4009 Village Park Dr
- 5001 Village Park Dr
- 108 Autumn Ridge Dr