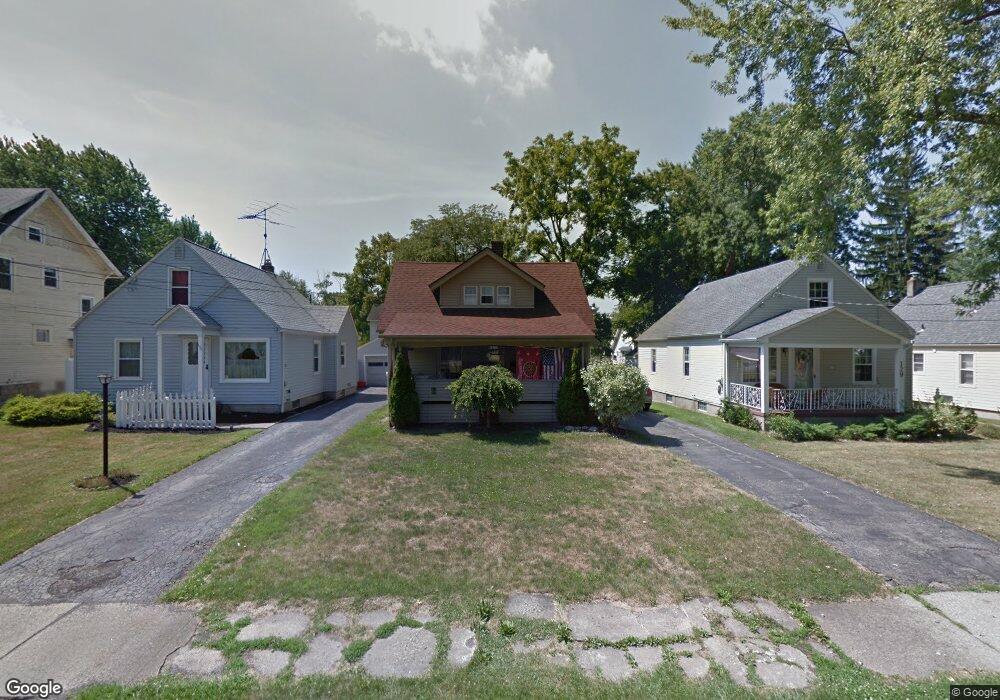
131 Maple Dr Youngstown, OH 44512
Estimated Value: $111,585 - $122,000
2
Beds
1
Bath
1,342
Sq Ft
$88/Sq Ft
Est. Value
About This Home
This home is located at 131 Maple Dr, Youngstown, OH 44512 and is currently estimated at $118,146, approximately $88 per square foot. 131 Maple Dr is a home located in Mahoning County with nearby schools including Boardman Glenwood Junior High School, Boardman High School, and Horizon Science Academy - Youngstown.
Ownership History
Date
Name
Owned For
Owner Type
Purchase Details
Closed on
Nov 16, 2021
Sold by
Stoops Janie and Dohar Janie
Bought by
Dohar Peter M
Current Estimated Value
Purchase Details
Closed on
Sep 29, 2005
Sold by
Dohar Peter M and Dohar Janie
Bought by
Dohar Peter M and Dohar Janie
Home Financials for this Owner
Home Financials are based on the most recent Mortgage that was taken out on this home.
Original Mortgage
$73,950
Outstanding Balance
$40,005
Interest Rate
5.93%
Mortgage Type
New Conventional
Estimated Equity
$78,141
Purchase Details
Closed on
Oct 19, 2001
Sold by
Danielle Schneider
Bought by
Dohar Peter M
Home Financials for this Owner
Home Financials are based on the most recent Mortgage that was taken out on this home.
Original Mortgage
$64,056
Interest Rate
6.88%
Mortgage Type
VA
Purchase Details
Closed on
Nov 24, 1989
Bought by
Schneider Danielle
Create a Home Valuation Report for This Property
The Home Valuation Report is an in-depth analysis detailing your home's value as well as a comparison with similar homes in the area
Home Values in the Area
Average Home Value in this Area
Purchase History
| Date | Buyer | Sale Price | Title Company |
|---|---|---|---|
| Dohar Peter M | -- | None Available | |
| Dohar Peter M | -- | -- | |
| Dohar Peter M | $63,300 | -- | |
| Schneider Danielle | $33,000 | -- |
Source: Public Records
Mortgage History
| Date | Status | Borrower | Loan Amount |
|---|---|---|---|
| Open | Dohar Peter M | $73,950 | |
| Closed | Dohar Peter M | $64,056 |
Source: Public Records
Tax History Compared to Growth
Tax History
| Year | Tax Paid | Tax Assessment Tax Assessment Total Assessment is a certain percentage of the fair market value that is determined by local assessors to be the total taxable value of land and additions on the property. | Land | Improvement |
|---|---|---|---|---|
| 2024 | $1,277 | $24,880 | $3,120 | $21,760 |
| 2023 | $1,260 | $24,880 | $3,120 | $21,760 |
| 2022 | $1,233 | $18,620 | $3,020 | $15,600 |
| 2021 | $1,234 | $18,620 | $3,020 | $15,600 |
| 2020 | $1,240 | $18,620 | $3,020 | $15,600 |
| 2019 | $1,246 | $16,480 | $2,670 | $13,810 |
| 2018 | $1,072 | $16,480 | $2,670 | $13,810 |
| 2017 | $1,057 | $16,480 | $2,670 | $13,810 |
| 2016 | $1,361 | $21,080 | $3,190 | $17,890 |
| 2015 | $1,334 | $21,080 | $3,190 | $17,890 |
| 2014 | $1,338 | $21,080 | $3,190 | $17,890 |
| 2013 | $1,321 | $21,080 | $3,190 | $17,890 |
Source: Public Records
Map
Nearby Homes
- 4504 Southern Blvd
- 4508 Southern Blvd
- 94 Shadyside Dr
- 94 Beechwood Dr
- 83 Beechwood Dr
- 60 Shadyside Dr
- 4307 Helena Ave
- 30 Pinehurst Ave
- 4144 Helena Ave
- 204 Lowell Ave
- 28 Terrace Dr
- 4552 New England Blvd
- 188 Clarencedale Ave
- 241 Clarencedale Ave
- 230 Clarencedale Ave
- 3916 Howard St
- 4038 Sunset Blvd
- 4250 Oak Knoll Dr
- 0 Indianola Rd
- 486 Annawan Ln