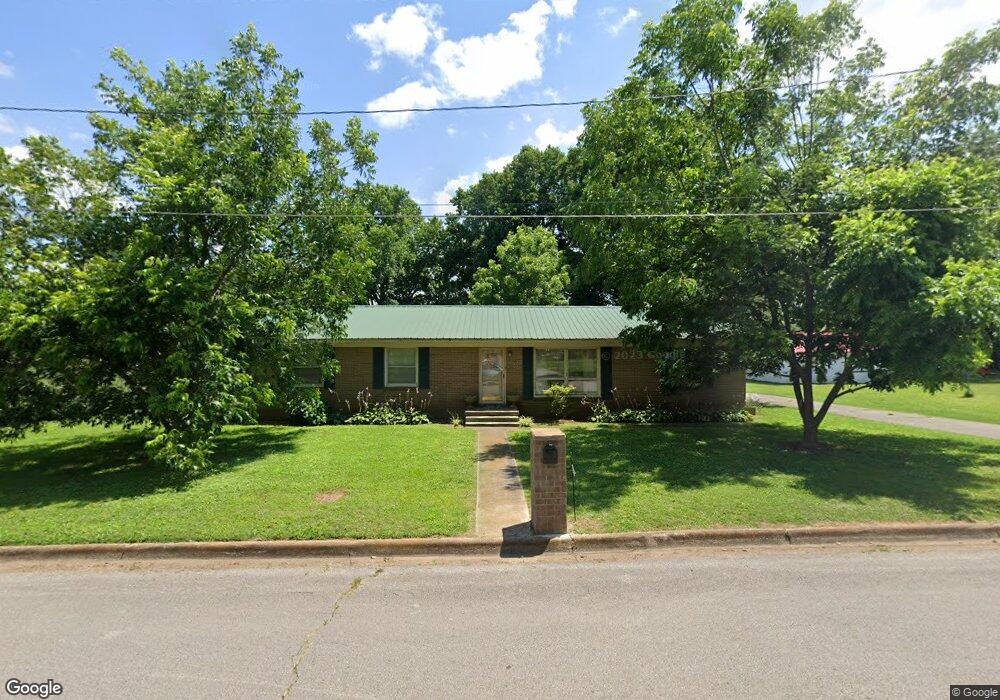
131 Morrow Dr Lawrenceburg, TN 38464
Estimated Value: $199,435 - $274,000
--
Bed
2
Baths
1,620
Sq Ft
$147/Sq Ft
Est. Value
About This Home
This home is located at 131 Morrow Dr, Lawrenceburg, TN 38464 and is currently estimated at $238,609, approximately $147 per square foot. 131 Morrow Dr is a home located in Lawrence County with nearby schools including Ingram Sowell Elementary School, Lawrenceburg Public Elementary School, and David Crockett Elementary School.
Ownership History
Date
Name
Owned For
Owner Type
Purchase Details
Closed on
Jun 21, 2002
Sold by
Bryant Bobby W
Bought by
Bryant Reva F
Current Estimated Value
Purchase Details
Closed on
Feb 18, 1998
Sold by
Smith Joel C
Bought by
Byrant Bobby W and Byrant Reva F
Purchase Details
Closed on
May 28, 1992
Bought by
Smith Joel C and Smith Barbara
Purchase Details
Closed on
Mar 27, 1987
Bought by
Stewart Herman and Wife Marie
Purchase Details
Closed on
Jan 1, 1983
Create a Home Valuation Report for This Property
The Home Valuation Report is an in-depth analysis detailing your home's value as well as a comparison with similar homes in the area
Home Values in the Area
Average Home Value in this Area
Purchase History
| Date | Buyer | Sale Price | Title Company |
|---|---|---|---|
| Bryant Reva F | -- | -- | |
| Byrant Bobby W | $68,500 | -- | |
| Smith Joel C | $44,000 | -- | |
| Stewart Herman | -- | -- | |
| -- | $38,000 | -- |
Source: Public Records
Tax History Compared to Growth
Tax History
| Year | Tax Paid | Tax Assessment Tax Assessment Total Assessment is a certain percentage of the fair market value that is determined by local assessors to be the total taxable value of land and additions on the property. | Land | Improvement |
|---|---|---|---|---|
| 2025 | $1,269 | $40,850 | $0 | $0 |
| 2024 | $1,269 | $40,850 | $5,000 | $35,850 |
| 2023 | $1,269 | $40,850 | $5,000 | $35,850 |
| 2022 | $1,269 | $40,850 | $5,000 | $35,850 |
| 2021 | $896 | $20,375 | $3,000 | $17,375 |
| 2020 | $896 | $20,375 | $3,000 | $17,375 |
| 2019 | $896 | $20,375 | $3,000 | $17,375 |
| 2018 | $896 | $20,375 | $3,000 | $17,375 |
| 2017 | $896 | $20,375 | $3,000 | $17,375 |
| 2016 | $896 | $20,375 | $3,000 | $17,375 |
| 2015 | $848 | $20,375 | $3,000 | $17,375 |
| 2014 | $843 | $20,250 | $3,000 | $17,250 |
Source: Public Records
Map
Nearby Homes