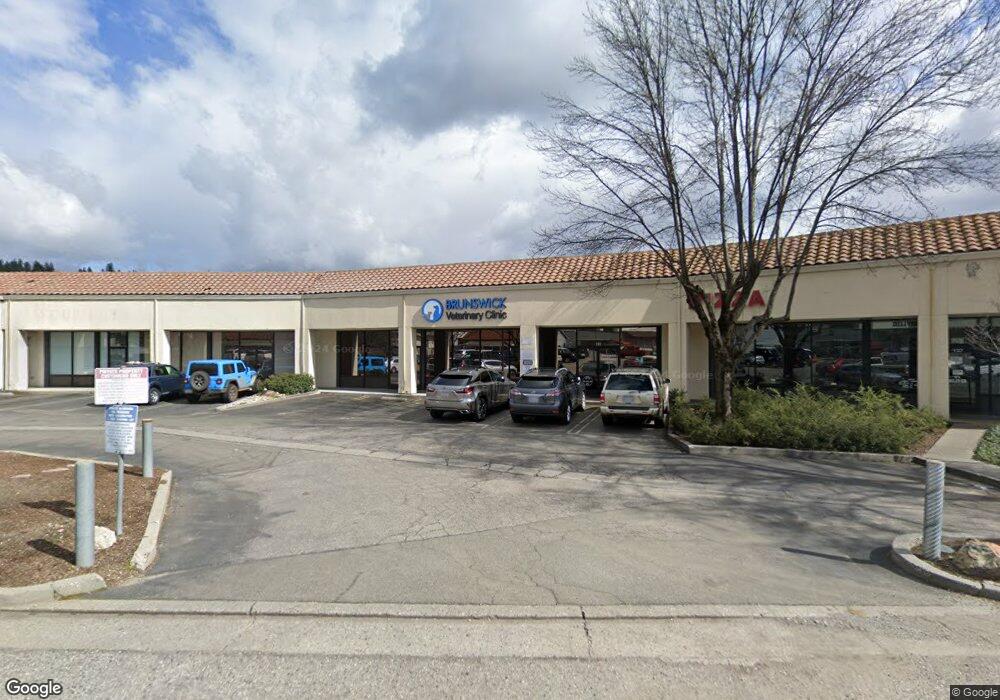
131 Olympia Park Rd Grass Valley, CA 95945
Estimated Value: $1,429,596
--
Bed
--
Bath
5,808
Sq Ft
$246/Sq Ft
Est. Value
About This Home
This home is located at 131 Olympia Park Rd, Grass Valley, CA 95945 and is currently estimated at $1,429,596, approximately $246 per square foot. 131 Olympia Park Rd is a home located in Nevada County with nearby schools including Bell Hill Academy, Margaret G. Scotten Elementary School, and Lyman Gilmore Middle School.
Ownership History
Date
Name
Owned For
Owner Type
Purchase Details
Closed on
May 3, 2024
Sold by
Wegman Erhard R
Bought by
Erhard And Victoria Wegman Family Trust and Wegman
Current Estimated Value
Purchase Details
Closed on
Mar 26, 2021
Sold by
Wegman Victoria
Bought by
Wegman Erhard R
Home Financials for this Owner
Home Financials are based on the most recent Mortgage that was taken out on this home.
Original Mortgage
$841,000
Interest Rate
2.8%
Mortgage Type
Commercial
Purchase Details
Closed on
Mar 11, 2021
Sold by
Casa Blanca Llc
Bought by
Wegman Erhard R
Home Financials for this Owner
Home Financials are based on the most recent Mortgage that was taken out on this home.
Original Mortgage
$841,000
Interest Rate
2.8%
Mortgage Type
Commercial
Purchase Details
Closed on
Dec 22, 2010
Sold by
Schuff Jay and Hahn Rebecca A
Bought by
Casa Blanca Llc
Create a Home Valuation Report for This Property
The Home Valuation Report is an in-depth analysis detailing your home's value as well as a comparison with similar homes in the area
Home Values in the Area
Average Home Value in this Area
Purchase History
| Date | Buyer | Sale Price | Title Company |
|---|---|---|---|
| Erhard And Victoria Wegman Family Trust | -- | None Listed On Document | |
| Wegman Erhard R | -- | Old Republic Title Company | |
| Wegman Erhard R | $1,325,000 | Old Republic Title Company | |
| Casa Blanca Llc | -- | None Available | |
| Schuff Jay | -- | None Available |
Source: Public Records
Mortgage History
| Date | Status | Borrower | Loan Amount |
|---|---|---|---|
| Previous Owner | Wegman Erhard R | $841,000 | |
| Previous Owner | Wegman Erhard R | $841,000 |
Source: Public Records
Tax History Compared to Growth
Tax History
| Year | Tax Paid | Tax Assessment Tax Assessment Total Assessment is a certain percentage of the fair market value that is determined by local assessors to be the total taxable value of land and additions on the property. | Land | Improvement |
|---|---|---|---|---|
| 2025 | $16,034 | $1,434,220 | $378,850 | $1,055,370 |
| 2024 | $15,816 | $1,406,099 | $371,422 | $1,034,677 |
| 2023 | $15,816 | $1,378,530 | $364,140 | $1,014,390 |
| 2022 | $9,249 | $748,190 | $196,027 | $552,163 |
| 2021 | $9,071 | $733,521 | $192,184 | $541,337 |
| 2020 | $8,714 | $726,001 | $190,214 | $535,787 |
| 2019 | $9,093 | $711,767 | $186,485 | $525,282 |
| 2018 | $9,066 | $697,812 | $182,829 | $514,983 |
| 2017 | $8,766 | $684,131 | $179,245 | $504,886 |
| 2016 | $7,976 | $670,718 | $175,731 | $494,987 |
| 2015 | $7,964 | $660,645 | $173,092 | $487,553 |
| 2014 | $7,861 | $647,706 | $169,702 | $478,004 |
Source: Public Records
Map
Nearby Homes
- 133 Brunswick Rd
- 970 Laurel Ln
- 1025 Amber Loop
- 975 Amber Loop
- 262 W Olympia Dr
- 987 Pampas Dr
- 136 Jackrabbit Rd
- 114 Jackrabbit Rd
- 118 Jackrabbit Rd
- 106 Jackrabbit Rd
- 110 Jackrabbit Rd
- 122 Jackrabbit Rd
- 126 Jackrabbit Rd
- 614 Cold Spring Ct
- 606 Cold Spring Ct
- 611 Cold Spring Ct
- 605 Cold Spring Ct
- 607 Cold Spring Ct
- 2300 Nevada City Hwy
- 506 Liberty Ct
- 137 Olympia Park Rd
- 0 Olympia Park Rd Unit 99602503
- 0 Olympia Park Rd Unit 10606456
- 0 Olympia Park Rd Unit 12602538
- 715 Maltman Dr
- 0 Maltman Dr Unit 19039586
- 0 Maltman Dr
- 734 Maltman Dr
- 1781 E Main St
- 671 Maltman Dr
- 1793 E Main St
- 574 Sutton Way
- 653 Maltman Dr
- 11708 Nevada City Hwy
- 1784 E Main St
- 1802 E Main St
- 633 Maltman Dr
- 160 Glenbrook Dr
- 160 Glenbrook Dr
- 1912 Nevada City Hwy