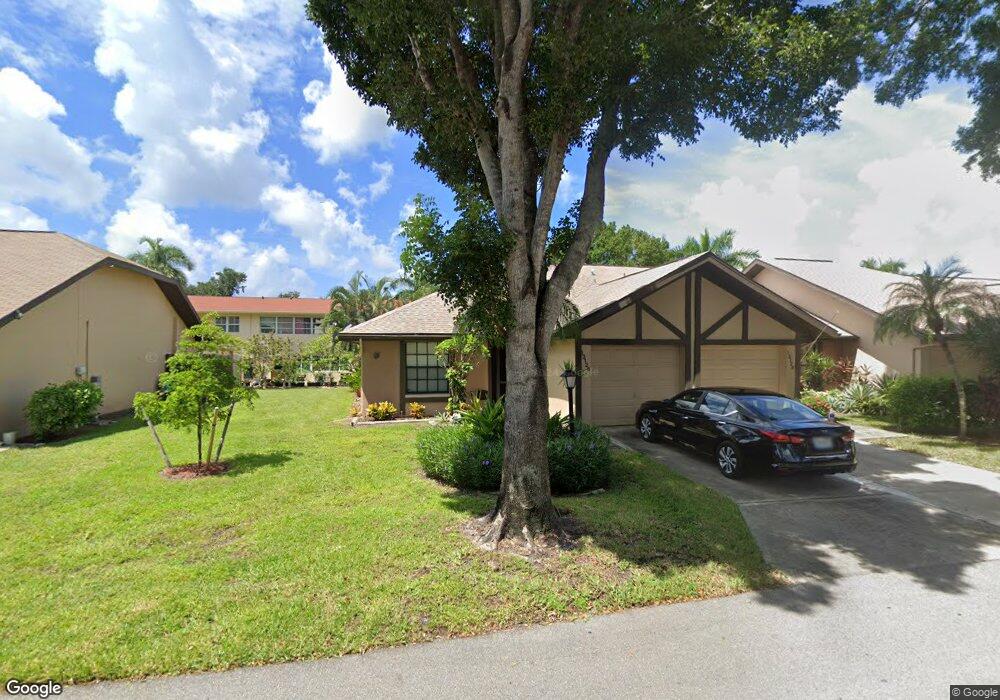
13126 Burningtree Ave Fort Myers, FL 33919
Estimated Value: $170,998 - $242,000
2
Beds
2
Baths
994
Sq Ft
$196/Sq Ft
Est. Value
About This Home
This home is located at 13126 Burningtree Ave, Fort Myers, FL 33919 and is currently estimated at $194,500, approximately $195 per square foot. 13126 Burningtree Ave is a home located in Lee County with nearby schools including Orangewood Elementary School, Allen Park Elementary School, and Edison Park Creative & Expressive Arts School.
Ownership History
Date
Name
Owned For
Owner Type
Purchase Details
Closed on
May 9, 2022
Sold by
Dennis Norberg
Bought by
Norberg Jeffrey
Current Estimated Value
Purchase Details
Closed on
Apr 26, 2011
Sold by
Herbst Virginia
Bought by
Norberg Dennis
Purchase Details
Closed on
Sep 14, 2001
Sold by
Obrien Marcia K and Obrien Angela M
Bought by
Herbst Virginia
Home Financials for this Owner
Home Financials are based on the most recent Mortgage that was taken out on this home.
Original Mortgage
$60,700
Interest Rate
6.97%
Purchase Details
Closed on
Oct 27, 1995
Sold by
Kasparek Carolyn
Bought by
Obrien Marcia K and Obrien Angela M
Home Financials for this Owner
Home Financials are based on the most recent Mortgage that was taken out on this home.
Original Mortgage
$49,600
Interest Rate
7.58%
Create a Home Valuation Report for This Property
The Home Valuation Report is an in-depth analysis detailing your home's value as well as a comparison with similar homes in the area
Home Values in the Area
Average Home Value in this Area
Purchase History
| Date | Buyer | Sale Price | Title Company |
|---|---|---|---|
| Norberg Jeffrey | -- | First International Title | |
| Norberg Dennis | $85,000 | Attorney | |
| Herbst Virginia | $75,900 | -- | |
| Obrien Marcia K | $62,000 | -- |
Source: Public Records
Mortgage History
| Date | Status | Borrower | Loan Amount |
|---|---|---|---|
| Previous Owner | Herbst Virginia | $60,700 | |
| Previous Owner | Obrien Marcia K | $49,600 |
Source: Public Records
Tax History Compared to Growth
Tax History
| Year | Tax Paid | Tax Assessment Tax Assessment Total Assessment is a certain percentage of the fair market value that is determined by local assessors to be the total taxable value of land and additions on the property. | Land | Improvement |
|---|---|---|---|---|
| 2025 | $2,314 | $156,172 | $42,797 | $112,590 |
| 2024 | $2,635 | $149,370 | $23,963 | $124,219 |
| 2023 | $2,635 | $172,202 | $20,399 | $150,857 |
| 2022 | $2,256 | $132,992 | $0 | $0 |
| 2021 | $1,938 | $120,902 | $15,696 | $105,206 |
| 2020 | $1,948 | $128,388 | $15,000 | $113,388 |
| 2019 | $1,715 | $103,360 | $15,000 | $88,360 |
| 2018 | $1,701 | $104,974 | $15,000 | $89,974 |
| 2017 | $1,617 | $99,321 | $15,000 | $84,321 |
| 2016 | $1,463 | $84,088 | $15,535 | $68,553 |
| 2015 | $1,432 | $84,796 | $16,499 | $68,297 |
| 2014 | $1,288 | $73,903 | $13,444 | $60,459 |
| 2013 | -- | $59,799 | $5,365 | $54,434 |
Source: Public Records
Map
Nearby Homes
- 13151 Kings Point Dr Unit 13A
- 13150 Kings Point Dr Unit 15C
- 13150 Kings Point Dr Unit 11C
- 13160 Kings Point Dr Unit 4
- 13160 Kings Point Dr Unit 2
- 9315 Central Park Dr Unit 201
- 13137 Hampshire Ct
- 9270 Lake Park Dr Unit 101
- 13134 Feather Sound Dr Unit 409
- 9303 Lennex Ln
- 9351 Lennex Ln Unit 4728
- 9241 Central Park Dr Unit 103
- 9339 Lennex Ln
- 13162 Feather Sound Dr Unit 601
- 9281 Central Park Dr Unit 206
- 9782 Owlclover St
- 9758 Deerfoot Dr
- 9721 Deerfoot Dr
- 9708 Foxglove Cir Unit 33
- 4384 Bowsprit Ct Unit 2A
- 13124 Burningtree Ave
- 13130 Burningtree Ave
- 13122 Burningtree Ave
- 13132 Burningtree Ave Unit 508
- 13120 Burningtree Ave
- 13151 13151 Kings Point Dr #6a Dr E
- 13134 Burningtree Ave
- 13118 Burningtree Ave Unit 514
- 13127 Burningtree Ave Unit 422
- 13125 Burningtree Ave
- 13131 Burningtree Ave
- 13123 Burningtree Ave
- 13121 Burningtree Ave
- 13133 Burningtree Ave
- 13161/163 Kings Point Dr
- 13138 Burningtree Ave
- 13135 Burningtree Ave
- 13119 Burningtree Ave Unit 418
- 13151 Kings Point Dr Unit 11A
- 13151 Kings Point Dr Unit 12A