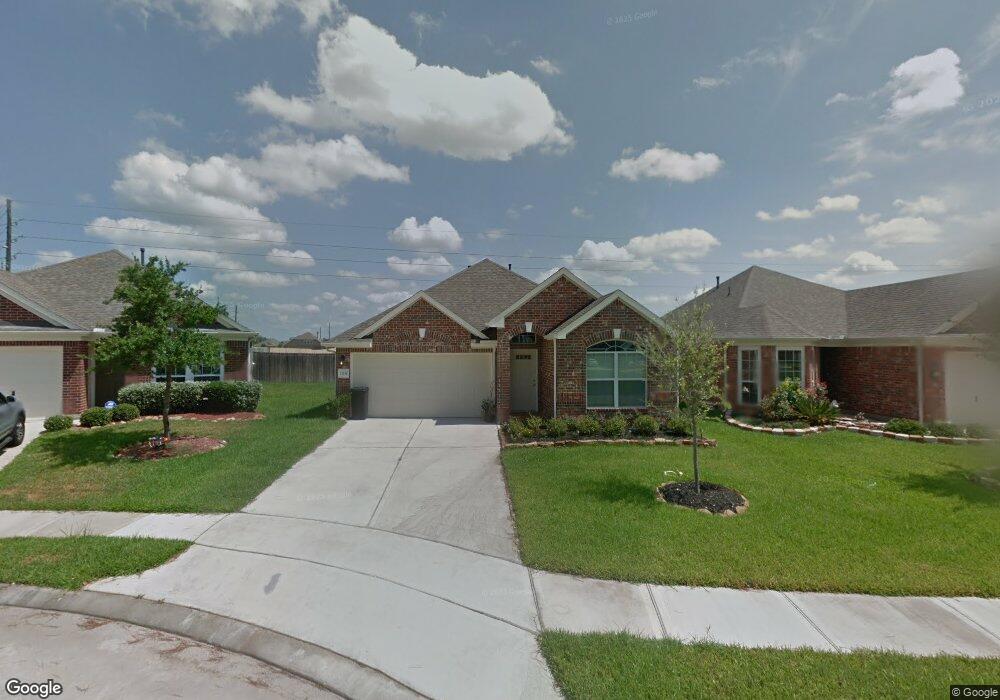
13134 Royal Bend Ln Tomball, TX 77377
Northpointe NeighborhoodEstimated Value: $291,521 - $303,000
3
Beds
2
Baths
1,663
Sq Ft
$179/Sq Ft
Est. Value
About This Home
This home is located at 13134 Royal Bend Ln, Tomball, TX 77377 and is currently estimated at $297,630, approximately $178 per square foot. 13134 Royal Bend Ln is a home located in Harris County with nearby schools including Canyon Pointe Elementary School, Oakcrest Intermediate School, and Tomball Memorial High School.
Ownership History
Date
Name
Owned For
Owner Type
Purchase Details
Closed on
May 6, 2016
Sold by
Brownlow Brittany A and Tones John N
Bought by
Herrera Marvin D and Bastian G. Tommy
Current Estimated Value
Home Financials for this Owner
Home Financials are based on the most recent Mortgage that was taken out on this home.
Original Mortgage
$186,558
Outstanding Balance
$148,947
Interest Rate
3.75%
Mortgage Type
FHA
Estimated Equity
$148,683
Purchase Details
Closed on
Jun 28, 2010
Sold by
Innovation Construction Unlimited Llc
Bought by
Brownlow Brittany A and Tones John N
Home Financials for this Owner
Home Financials are based on the most recent Mortgage that was taken out on this home.
Original Mortgage
$128,173
Interest Rate
5.12%
Mortgage Type
FHA
Purchase Details
Closed on
Apr 13, 2010
Sold by
Perry Homes Llc
Bought by
E & E Developers Llc
Create a Home Valuation Report for This Property
The Home Valuation Report is an in-depth analysis detailing your home's value as well as a comparison with similar homes in the area
Home Values in the Area
Average Home Value in this Area
Purchase History
| Date | Buyer | Sale Price | Title Company |
|---|---|---|---|
| Herrera Marvin D | -- | None Available | |
| Brownlow Brittany A | -- | Chicago Title | |
| E & E Developers Llc | -- | None Available |
Source: Public Records
Mortgage History
| Date | Status | Borrower | Loan Amount |
|---|---|---|---|
| Open | Herrera Marvin D | $186,558 | |
| Previous Owner | Brownlow Brittany A | $128,173 |
Source: Public Records
Tax History Compared to Growth
Tax History
| Year | Tax Paid | Tax Assessment Tax Assessment Total Assessment is a certain percentage of the fair market value that is determined by local assessors to be the total taxable value of land and additions on the property. | Land | Improvement |
|---|---|---|---|---|
| 2025 | $7,944 | $289,231 | $56,474 | $232,757 |
| 2024 | $7,944 | $294,507 | $56,474 | $238,033 |
| 2023 | $7,944 | $294,507 | $56,474 | $238,033 |
| 2022 | $7,836 | $271,163 | $46,491 | $224,672 |
| 2021 | $6,554 | $214,436 | $45,635 | $168,801 |
| 2020 | $6,280 | $196,935 | $45,635 | $151,300 |
| 2019 | $6,619 | $202,195 | $38,219 | $163,976 |
| 2018 | $2,585 | $192,945 | $38,219 | $154,726 |
| 2017 | $6,450 | $192,945 | $38,219 | $154,726 |
| 2016 | $6,113 | $184,681 | $38,219 | $146,462 |
| 2015 | $5,169 | $174,956 | $38,219 | $136,737 |
| 2014 | $5,169 | $158,884 | $38,219 | $120,665 |
Source: Public Records
Map
Nearby Homes
- 18931 Winding Atwood Ln
- 13522 Carrill Bend Ln
- 19023 Wild Thornberry Dr
- 19006 Rustling Ridge Ln
- 18618 Oden Trace Dr
- 19026 Rustling Ridge Ln
- 12719 Rocky Briar Ln
- 18710 Winding Atwood Ln
- 12918 Chatfield Manor Ln
- 18803 Dusty Rose Ln
- 18603 Bridle Grove Ct
- 12610 Baldwin Springs Ct
- 18903 Danbridge Ct
- 18402 Sierra Falls Ct
- 18218 Russett Green Dr
- 12327 Northpointe Ridge Ln
- 13315 Edison Trace Ln
- 18630 Luma Cove Ln
- 18522 Cascade Timbers Ln
- 18626 Luma Cove Ln
- 13130 Royal Bend Ln
- 13138 Royal Bend Ln
- 13126 Royal Bend Ln
- 18915 Arrow Mill Ln
- 13122 Royal Bend Ln
- 18911 Arrow Mill Ln
- 13118 Royal Bend Ln
- 18907 Arrow Mill Ln
- 18903 Arrow Mill Ln
- 13114 Royal Bend Ln
- 18914 Bluestone Hollow Ln
- 18918 Bluestone Hollow Ln
- 13222 Brantfield Park Ln
- 18906 Bluestone Hollow Ln
- 13110 Royal Bend Ln
- 18922 Bluestone Hollow Ln
- 13226 Brantfield Park Ln
- 13106 Royal Bend Ln
- 13207 Brantfield Park Ln
- 13211 Brantfield Park Ln