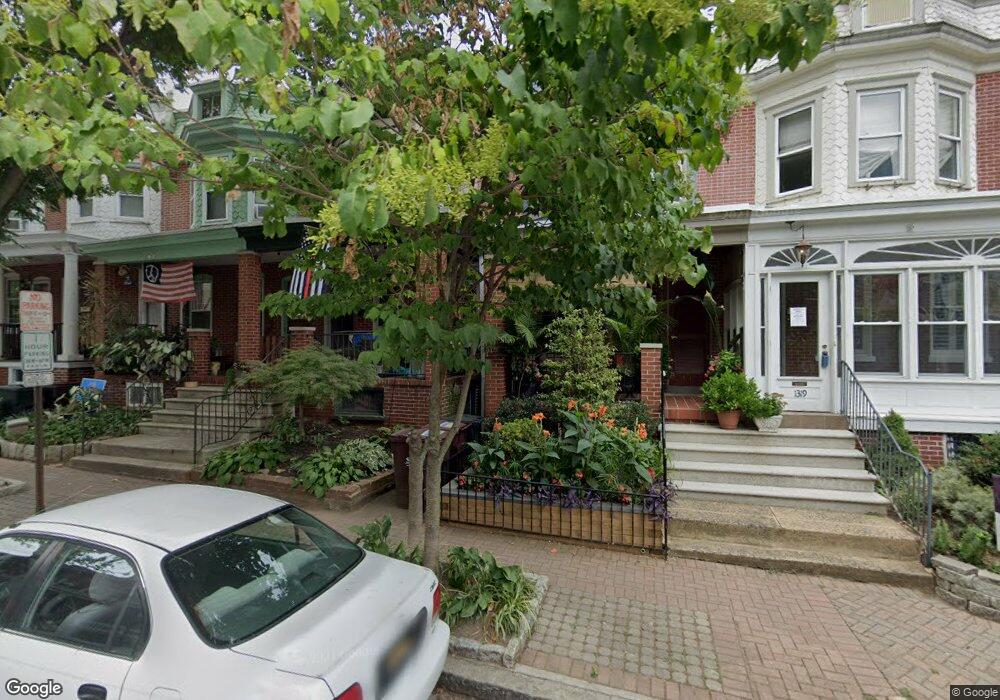
1315 N Tatnall St Wilmington, DE 19801
Midtown Brandywine NeighborhoodEstimated Value: $336,556 - $548,000
3
Beds
2
Baths
1,550
Sq Ft
$267/Sq Ft
Est. Value
About This Home
This home is located at 1315 N Tatnall St, Wilmington, DE 19801 and is currently estimated at $414,389, approximately $267 per square foot. 1315 N Tatnall St is a home located in New Castle County with nearby schools including Evan G. Shortlidge Academy, Skyline Middle School, and Alexis I. du Pont High School.
Ownership History
Date
Name
Owned For
Owner Type
Purchase Details
Closed on
Nov 21, 2016
Sold by
Vincent Peter B and Vincent Alaina
Bought by
Vincent Peter B and Vincent Alaina
Current Estimated Value
Purchase Details
Closed on
Jun 10, 2008
Sold by
Mcgill Christopher
Bought by
Jacobi Alaina and Vincent Peter B
Home Financials for this Owner
Home Financials are based on the most recent Mortgage that was taken out on this home.
Original Mortgage
$263,900
Interest Rate
6.4%
Mortgage Type
FHA
Purchase Details
Closed on
Feb 22, 2007
Sold by
Smith Gregory J and Smith Mary Ennis
Bought by
Mcgill Christopher
Home Financials for this Owner
Home Financials are based on the most recent Mortgage that was taken out on this home.
Original Mortgage
$200,000
Interest Rate
6.23%
Mortgage Type
Purchase Money Mortgage
Create a Home Valuation Report for This Property
The Home Valuation Report is an in-depth analysis detailing your home's value as well as a comparison with similar homes in the area
Home Values in the Area
Average Home Value in this Area
Purchase History
| Date | Buyer | Sale Price | Title Company |
|---|---|---|---|
| Vincent Peter B | -- | None Available | |
| Jacobi Alaina | $266,000 | None Available | |
| Mcgill Christopher | $250,000 | First American Title Ins Co |
Source: Public Records
Mortgage History
| Date | Status | Borrower | Loan Amount |
|---|---|---|---|
| Previous Owner | Jacobi Alaina | $263,900 | |
| Previous Owner | Mcgill Christopher | $200,000 |
Source: Public Records
Tax History Compared to Growth
Tax History
| Year | Tax Paid | Tax Assessment Tax Assessment Total Assessment is a certain percentage of the fair market value that is determined by local assessors to be the total taxable value of land and additions on the property. | Land | Improvement |
|---|---|---|---|---|
| 2024 | $1,863 | $59,700 | $8,200 | $51,500 |
| 2023 | $1,619 | $59,700 | $8,200 | $51,500 |
| 2022 | $1,626 | $59,700 | $8,200 | $51,500 |
| 2021 | $1,624 | $59,700 | $8,200 | $51,500 |
| 2020 | $1,633 | $59,700 | $8,200 | $51,500 |
| 2019 | $2,833 | $59,700 | $8,200 | $51,500 |
| 2018 | $1,626 | $59,700 | $8,200 | $51,500 |
| 2017 | $1,623 | $59,700 | $8,200 | $51,500 |
| 2016 | $1,538 | $59,700 | $8,200 | $51,500 |
| 2015 | $2,530 | $59,700 | $8,200 | $51,500 |
| 2014 | $2,402 | $59,700 | $8,200 | $51,500 |
Source: Public Records
Map
Nearby Homes
- 1311 N Tatnall St
- 1210 N King St
- 210 E 14th St
- 1025 N Madison St Unit E109
- 903 Lovering Ave
- 1517 N Adams St Unit 13
- 1806 N West St
- 1802 C N Washington St
- 925 Lovering Ave
- 315 E 13th St
- 831 Windsor St
- 411 W 8th St
- 305 1/2 W 19th St
- 309 W 19th St
- 2009 N Tatnall St
- 1921 N Washington St
- 834 N Monroe St
- 1025 Clifford Brown Walk
- 1112 Clifford Brown Walk
- 1 W Mccaulley Ct
- 1313 N Tatnall St
- 1317 N Tatnall St
- 1319 N Tatnall St
- 1309 N Tatnall St
- 1321 N Tatnall St
- 1323 N Tatnall St
- 1305 N Tatnall St
- 1325 N Tatnall St
- 1310 N West St
- 1303 N Tatnall St
- 1312 N West St
- 1308 N West St
- 1314 N West St
- 1306 N West St
- 1316 N West St
- 1301 N Tatnall St
- 1327 N Tatnall St
- 1304 N West St
- 1318 N West St
- 1302 N West St