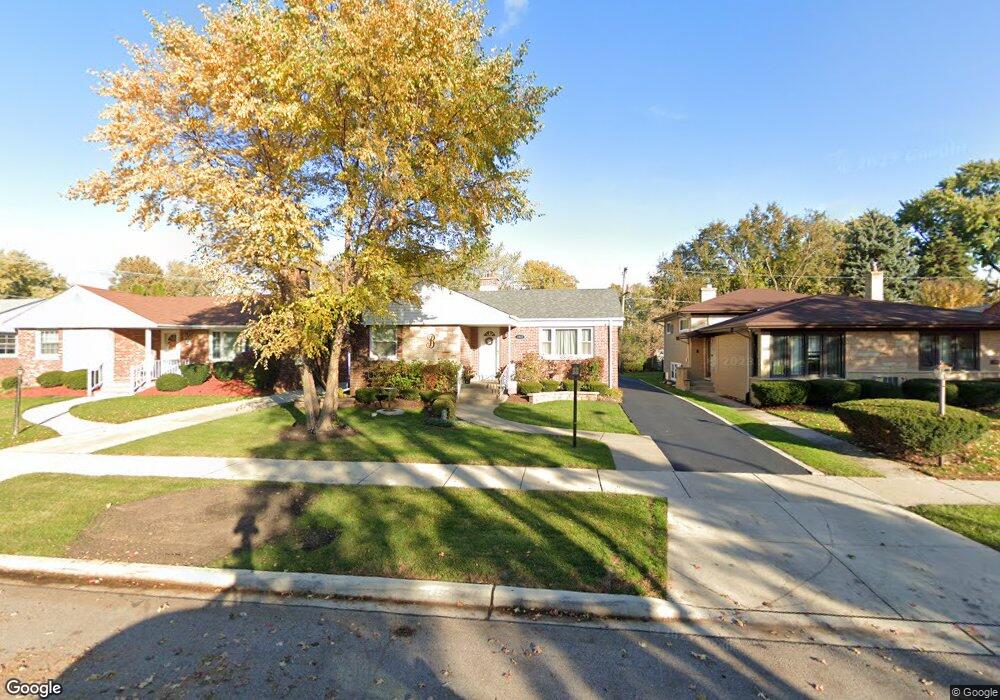
1317 Portsmouth Ave Westchester, IL 60154
Estimated Value: $284,000 - $363,000
2
Beds
1
Bath
1,100
Sq Ft
$285/Sq Ft
Est. Value
About This Home
This home is located at 1317 Portsmouth Ave, Westchester, IL 60154 and is currently estimated at $313,654, approximately $285 per square foot. 1317 Portsmouth Ave is a home located in Cook County with nearby schools including Westchester Primary School, Westchester Intermediate School, and Westchester Middle School.
Ownership History
Date
Name
Owned For
Owner Type
Purchase Details
Closed on
May 24, 2017
Sold by
Crossn Craig W and Crossn Jennifer P
Bought by
Barylowicz Tomasz
Current Estimated Value
Home Financials for this Owner
Home Financials are based on the most recent Mortgage that was taken out on this home.
Original Mortgage
$136,000
Outstanding Balance
$113,928
Interest Rate
4.37%
Mortgage Type
New Conventional
Estimated Equity
$199,726
Purchase Details
Closed on
Apr 14, 2003
Sold by
Ignatius Joan L
Bought by
Crossin Craig W and Crossin Jeannine P
Home Financials for this Owner
Home Financials are based on the most recent Mortgage that was taken out on this home.
Original Mortgage
$192,283
Interest Rate
5.95%
Mortgage Type
FHA
Create a Home Valuation Report for This Property
The Home Valuation Report is an in-depth analysis detailing your home's value as well as a comparison with similar homes in the area
Home Values in the Area
Average Home Value in this Area
Purchase History
| Date | Buyer | Sale Price | Title Company |
|---|---|---|---|
| Barylowicz Tomasz | $170,000 | First American Title | |
| Crossin Craig W | $195,000 | Cti | |
| Crossin Craig W | $195,000 | Cti |
Source: Public Records
Mortgage History
| Date | Status | Borrower | Loan Amount |
|---|---|---|---|
| Open | Barylowicz Tomasz | $136,000 | |
| Previous Owner | Crossin Craig W | $192,283 |
Source: Public Records
Tax History Compared to Growth
Tax History
| Year | Tax Paid | Tax Assessment Tax Assessment Total Assessment is a certain percentage of the fair market value that is determined by local assessors to be the total taxable value of land and additions on the property. | Land | Improvement |
|---|---|---|---|---|
| 2024 | $5,166 | $21,385 | $4,690 | $16,695 |
| 2023 | $4,627 | $23,000 | $4,690 | $18,310 |
| 2022 | $4,627 | $18,586 | $4,020 | $14,566 |
| 2021 | $4,505 | $18,586 | $4,020 | $14,566 |
| 2020 | $4,811 | $19,775 | $4,020 | $15,755 |
| 2019 | $4,308 | $18,679 | $3,685 | $14,994 |
| 2018 | $4,250 | $18,679 | $3,685 | $14,994 |
| 2017 | $4,185 | $18,679 | $3,685 | $14,994 |
| 2016 | $4,170 | $16,796 | $3,350 | $13,446 |
| 2015 | $4,080 | $16,796 | $3,350 | $13,446 |
| 2014 | $4,001 | $16,796 | $3,350 | $13,446 |
| 2013 | $4,199 | $19,335 | $3,350 | $15,985 |
Source: Public Records
Map
Nearby Homes
- 10072 Drury Ln
- 1500 Bristol Ave
- 1119 Newcastle Ave
- 1601 Bristol Ave
- 1623 Manchester Ave
- 920 Suffolk Ave
- 923 Manchester Ave
- 1247 S Mannheim Rd Unit 3
- 1816 Manchester Ave
- 814 Norfolk Ave
- 805 Norfolk Ave
- 1840 Gardner Rd
- 1907 Suffolk Ave
- 750 Bristol Ave
- 1900 Manchester Ave
- 1932 Newcastle Ave
- 10524 Camelot St
- 723 Balmoral Ave
- 626 Manchester Ave
- 10531 Camelot St
- 1321 Portsmouth Ave
- 1311 Portsmouth Ave
- 1325 Portsmouth Ave
- 1303 Portsmouth Ave
- 1310 Suffolk Ave
- 1316 Suffolk Ave
- 1320 Suffolk Ave
- 1331 Portsmouth Ave
- 1326 Suffolk Ave
- 1316 Portsmouth Ave
- 10015 Drury Ln
- 10011 Drury Ln
- 1335 Portsmouth Ave
- 1310 Portsmouth Ave
- 1322 Portsmouth Ave
- 10021 Drury Ln
- 10007 Drury Ln
- 1332 Suffolk Ave
- 1302 Portsmouth Ave
- 10027 Drury Ln