Estimated Value: $196,000 - $237,000
3
Beds
2
Baths
1,480
Sq Ft
$146/Sq Ft
Est. Value
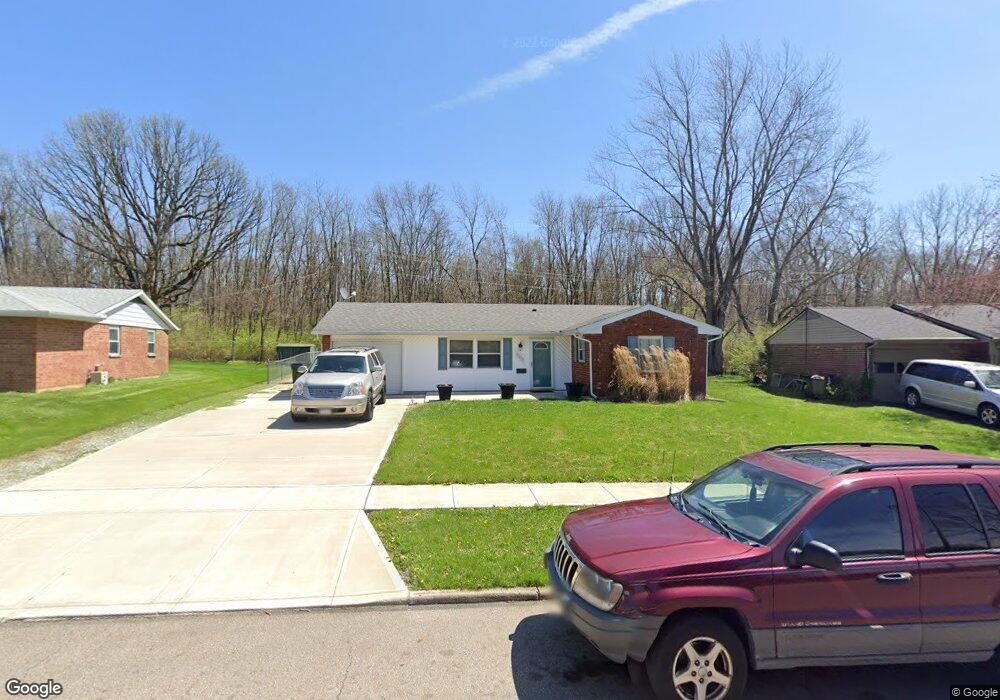
About This Home
This home is located at 1317 Saratoga Dr, Troy, OH 45373 and is currently estimated at $216,081, approximately $146 per square foot. 1317 Saratoga Dr is a home located in Miami County with nearby schools including Forest Elementary School, Troy Junior High School, and Van Cleve Elementary School.
Ownership History
Date
Name
Owned For
Owner Type
Purchase Details
Closed on
Apr 3, 2013
Sold by
Fannie Mae
Bought by
Hale David E and Hale Debra L
Current Estimated Value
Home Financials for this Owner
Home Financials are based on the most recent Mortgage that was taken out on this home.
Original Mortgage
$58,400
Outstanding Balance
$42,179
Interest Rate
3.99%
Mortgage Type
Adjustable Rate Mortgage/ARM
Estimated Equity
$173,902
Purchase Details
Closed on
Nov 7, 2012
Sold by
Goldsboro Angela P
Bought by
Fannie Mae and Federal National Mortgage Association
Purchase Details
Closed on
Oct 19, 2011
Sold by
Goldsboro Angela P
Bought by
Federal National Mortgage Association
Purchase Details
Closed on
Dec 12, 2002
Sold by
Martin Toni L
Bought by
Goldboro Angela P
Home Financials for this Owner
Home Financials are based on the most recent Mortgage that was taken out on this home.
Original Mortgage
$79,200
Interest Rate
6.25%
Mortgage Type
New Conventional
Create a Home Valuation Report for This Property
The Home Valuation Report is an in-depth analysis detailing your home's value as well as a comparison with similar homes in the area
Home Values in the Area
Average Home Value in this Area
Purchase History
| Date | Buyer | Sale Price | Title Company |
|---|---|---|---|
| Hale David E | $77,900 | Ohio Title Corp | |
| Fannie Mae | $56,667 | Attorney | |
| Federal National Mortgage Association | $56,667 | None Available | |
| Goldboro Angela P | $99,000 | -- |
Source: Public Records
Mortgage History
| Date | Status | Borrower | Loan Amount |
|---|---|---|---|
| Open | Hale David E | $58,400 | |
| Previous Owner | Goldboro Angela P | $79,200 |
Source: Public Records
Tax History Compared to Growth
Tax History
| Year | Tax Paid | Tax Assessment Tax Assessment Total Assessment is a certain percentage of the fair market value that is determined by local assessors to be the total taxable value of land and additions on the property. | Land | Improvement |
|---|---|---|---|---|
| 2024 | $1,915 | $50,790 | $13,160 | $37,630 |
| 2023 | $1,915 | $50,790 | $13,160 | $37,630 |
| 2022 | $1,594 | $50,790 | $13,160 | $37,630 |
| 2021 | $1,291 | $39,070 | $10,120 | $28,950 |
| 2020 | $1,293 | $39,070 | $10,120 | $28,950 |
| 2019 | $1,305 | $39,070 | $10,120 | $28,950 |
| 2018 | $1,161 | $33,460 | $10,710 | $22,750 |
| 2017 | $1,173 | $33,460 | $10,710 | $22,750 |
| 2016 | $1,155 | $33,460 | $10,710 | $22,750 |
| 2015 | $1,138 | $31,580 | $10,120 | $21,460 |
| 2014 | $1,138 | $31,580 | $10,120 | $21,460 |
| 2013 | $1,178 | $31,580 | $10,120 | $21,460 |
Source: Public Records
Map
Nearby Homes
- 1310 Saratoga Dr
- 1002 Stonyridge Ave
- 1329 Lee Rd
- 1760 Hunters Ridge Dr
- 1500 Paradise Trail
- 1075 Crestview Dr
- 429 Forrest Ln
- 1947 Woodcliffe Dr
- 1400 Troy Urbana Rd
- 605 Ohio Ave
- 1188 E Bentley Cir
- 1160 Waterloo St
- 731 Michigan Ave
- 1164 Waterloo St
- 190 Robin Hood Ln
- 708 N Market St
- 1137 Auburn St
- 755 W Bentley Cir
- 838 W Bentley Cir
- 813 W Bentley Cir
- 1321 Saratoga Dr
- 1313 Saratoga Dr
- 1325 Saratoga Dr
- 1309 Saratoga Dr
- 1314 Saratoga Dr
- 1315 Yorktown Dr
- 1321 Yorktown Dr
- 1322 Vicksburg Ct
- 1306 Saratoga Dr
- 1407 Saratoga Dr
- 1402 Saratoga Dr
- 1326 Vicksburg Ct
- 1305 Saratoga Dr
- 1411 Saratoga Dr
- 1325 Vicksburg Ct
- 1302 Saratoga Dr
- 1314 Yorktown Dr
- 1318 Yorktown Dr
- 1005 Stonyridge Ave
- 1412 Saratoga Dr