Estimated Value: $453,367 - $546,000
2
Beds
1
Bath
874
Sq Ft
$571/Sq Ft
Est. Value
About This Home
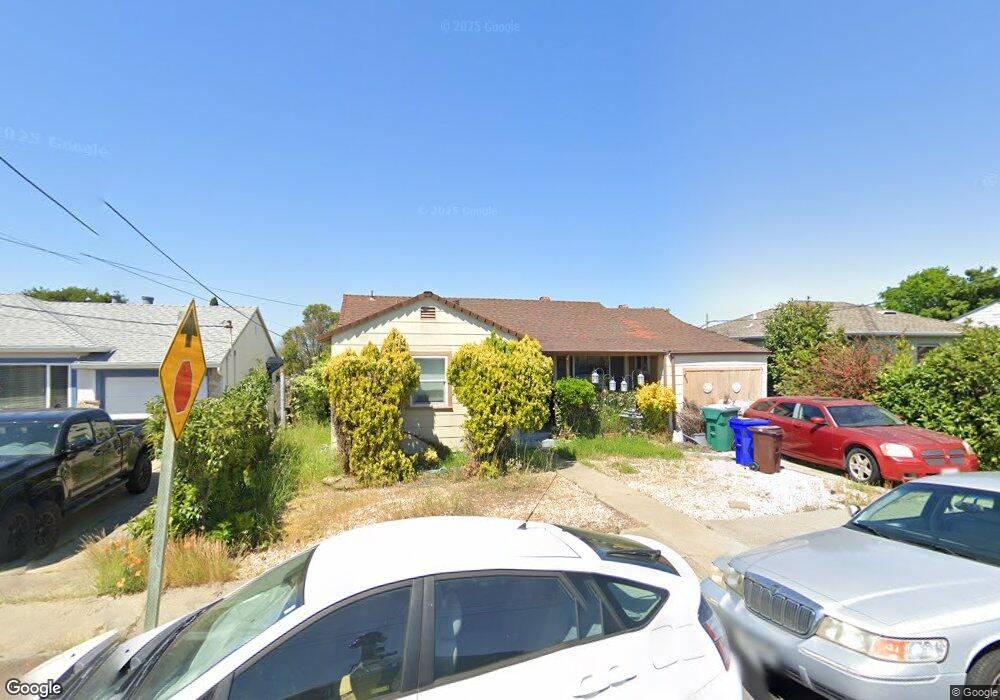
This home is located at 1318 Mahoney St, Rodeo, CA 94572 and is currently estimated at $499,092, approximately $571 per square foot. 1318 Mahoney St is a home located in Contra Costa County with nearby schools including Rodeo Hills Elementary School, Carquinez Middle School, and John Swett High School.
Ownership History
Date
Name
Owned For
Owner Type
Purchase Details
Closed on
Jun 29, 2022
Sold by
Patricia A Blakemore Living Trust
Bought by
Blakemore Derrick L and Blakemore Boris Angella
Current Estimated Value
Home Financials for this Owner
Home Financials are based on the most recent Mortgage that was taken out on this home.
Original Mortgage
$285,000
Outstanding Balance
$271,169
Interest Rate
5.1%
Mortgage Type
New Conventional
Estimated Equity
$227,924
Purchase Details
Closed on
Jan 28, 2021
Sold by
Schmelzer Jamesh Howard and Schmelzer Ophelia Levern
Bought by
Family Trust
Purchase Details
Closed on
Jan 14, 2021
Sold by
Blakemore Patricia and Honath Brenda
Bought by
Blakemore Patricia A and Patricia A Blakemore Living Tr
Purchase Details
Closed on
Aug 8, 1995
Sold by
Schmelzer James H and Schmelzer Ophelia L
Bought by
Family Trust Of James H Schmelzer & Ophe
Create a Home Valuation Report for This Property
The Home Valuation Report is an in-depth analysis detailing your home's value as well as a comparison with similar homes in the area
Home Values in the Area
Average Home Value in this Area
Purchase History
| Date | Buyer | Sale Price | Title Company |
|---|---|---|---|
| Blakemore Derrick L | $360,000 | Orange Coast Title | |
| Family Trust | -- | -- | |
| Blakemore Patricia A | -- | None Available | |
| Family Trust Of James H Schmelzer & Ophe | -- | -- |
Source: Public Records
Mortgage History
| Date | Status | Borrower | Loan Amount |
|---|---|---|---|
| Open | Blakemore Derrick L | $285,000 |
Source: Public Records
Tax History Compared to Growth
Tax History
| Year | Tax Paid | Tax Assessment Tax Assessment Total Assessment is a certain percentage of the fair market value that is determined by local assessors to be the total taxable value of land and additions on the property. | Land | Improvement |
|---|---|---|---|---|
| 2025 | $5,817 | $374,544 | $270,504 | $104,040 |
| 2024 | $5,755 | $367,200 | $265,200 | $102,000 |
| 2023 | $5,755 | $360,000 | $260,000 | $100,000 |
| 2022 | $2,075 | $45,668 | $22,834 | $22,834 |
| 2021 | $1,968 | $44,774 | $22,387 | $22,387 |
| 2019 | $1,921 | $43,448 | $21,724 | $21,724 |
| 2018 | $1,889 | $42,598 | $21,299 | $21,299 |
| 2017 | $1,856 | $41,764 | $20,882 | $20,882 |
| 2016 | $1,684 | $40,946 | $20,473 | $20,473 |
| 2015 | $1,674 | $40,332 | $20,166 | $20,166 |
| 2014 | $1,629 | $39,542 | $19,771 | $19,771 |
Source: Public Records
Map
Nearby Homes
- 1124 Mahoney St
- 915 California St
- 544 Napa Ave
- 808 4th St
- 725 Vaqueros Ave
- 836 Hawthorne Dr
- 220 Vaqueros Ave
- 832 Mariposa Ave
- 343 Rodeo Ave
- 715 Mariposa Ave
- 60 Railroad Ave
- 150 Rodeo Ave
- 201 Lake Ave
- 943 Coral Ridge Cir
- 839 Reef Point Dr
- 1006 Chelsea
- 1186 Waverly Cir
- 802 Dover
- 996 Coral Ridge Cir
- 405 Weymouth