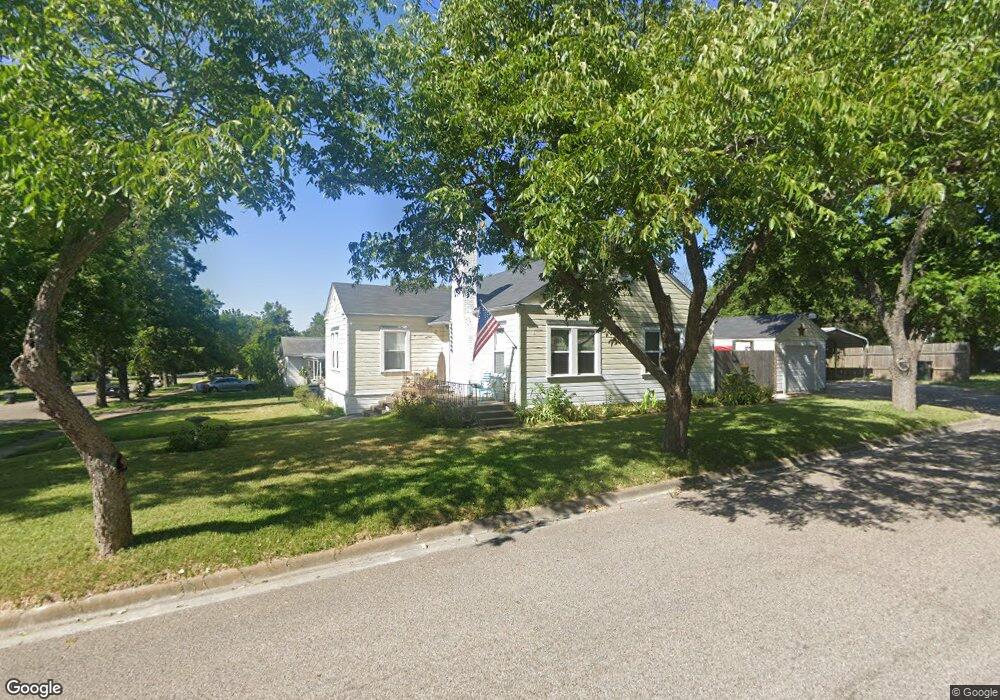
1318 N 4th St Temple, TX 76501
Jackson Park District NeighborhoodEstimated Value: $148,783 - $174,000
2
Beds
1
Bath
1,344
Sq Ft
$120/Sq Ft
Est. Value
About This Home
This home is located at 1318 N 4th St, Temple, TX 76501 and is currently estimated at $161,446, approximately $120 per square foot. 1318 N 4th St is a home located in Bell County with nearby schools including Jefferson Elementary School, Lamar Middle, and Temple High School.
Ownership History
Date
Name
Owned For
Owner Type
Purchase Details
Closed on
Apr 16, 2021
Sold by
Netters Jimmie C and Netters Brenda
Bought by
Ferguson James Tyron and Ferguson Sharla Elaine
Current Estimated Value
Purchase Details
Closed on
Jul 8, 2011
Sold by
Mankin Jack T and Mankin Allison
Bought by
Netters Ii Jimmie C
Home Financials for this Owner
Home Financials are based on the most recent Mortgage that was taken out on this home.
Original Mortgage
$53,600
Interest Rate
4.65%
Mortgage Type
New Conventional
Create a Home Valuation Report for This Property
The Home Valuation Report is an in-depth analysis detailing your home's value as well as a comparison with similar homes in the area
Home Values in the Area
Average Home Value in this Area
Purchase History
| Date | Buyer | Sale Price | Title Company |
|---|---|---|---|
| Ferguson James Tyron | -- | Stewart Title Company | |
| Netters Ii Jimmie C | -- | Fct |
Source: Public Records
Mortgage History
| Date | Status | Borrower | Loan Amount |
|---|---|---|---|
| Previous Owner | Netters Ii Jimmie C | $53,600 |
Source: Public Records
Tax History Compared to Growth
Tax History
| Year | Tax Paid | Tax Assessment Tax Assessment Total Assessment is a certain percentage of the fair market value that is determined by local assessors to be the total taxable value of land and additions on the property. | Land | Improvement |
|---|---|---|---|---|
| 2025 | $1,661 | $136,982 | $24,674 | $112,308 |
| 2024 | $1,661 | $134,706 | $22,770 | $111,936 |
| 2023 | $3,378 | $147,320 | $0 | $0 |
| 2022 | $3,207 | $133,927 | $18,133 | $115,794 |
| 2021 | $2,580 | $100,534 | $13,800 | $86,734 |
| 2020 | $2,802 | $104,423 | $13,800 | $90,623 |
| 2019 | $2,057 | $75,248 | $6,900 | $68,348 |
| 2018 | $2,013 | $73,047 | $6,900 | $66,147 |
| 2017 | $1,996 | $72,899 | $6,900 | $65,999 |
| 2016 | $1,871 | $68,326 | $6,900 | $61,426 |
| 2014 | $1,776 | $67,505 | $0 | $0 |
Source: Public Records
Map
Nearby Homes