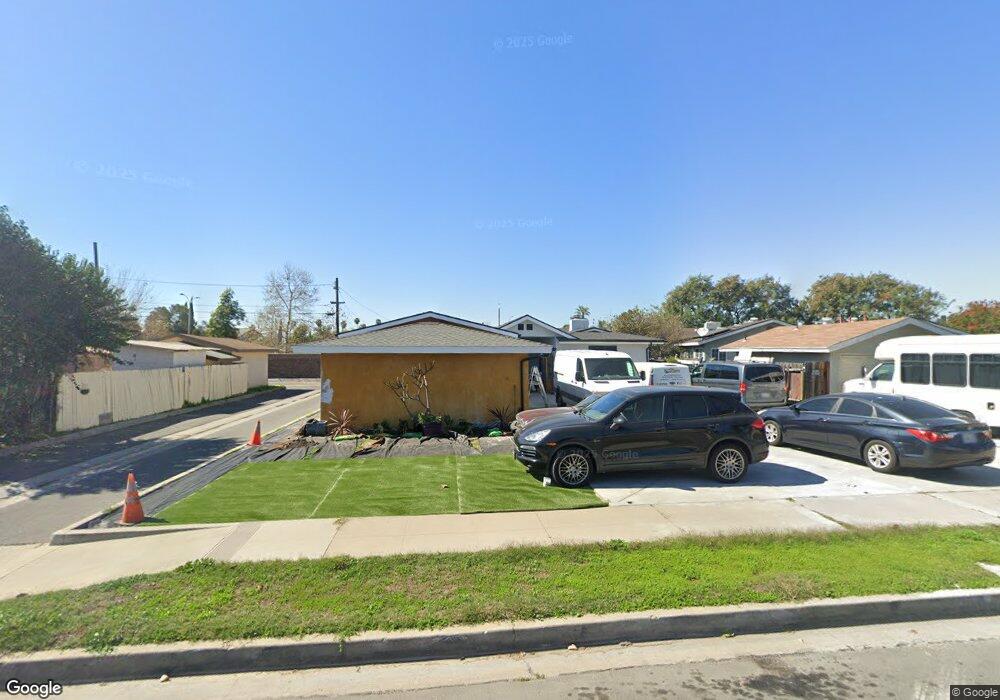
1319 N Catalpa Ave Anaheim, CA 92801
Northwest Anaheim NeighborhoodEstimated Value: $847,000 - $1,150,000
4
Beds
2
Baths
1,963
Sq Ft
$499/Sq Ft
Est. Value
About This Home
This home is located at 1319 N Catalpa Ave, Anaheim, CA 92801 and is currently estimated at $979,498, approximately $498 per square foot. 1319 N Catalpa Ave is a home located in Orange County with nearby schools including John Marshall Elementary School, Brookhurst Junior High School, and Savanna High School.
Ownership History
Date
Name
Owned For
Owner Type
Purchase Details
Closed on
Mar 7, 2024
Sold by
Miguel Frances M
Bought by
Halmajan Dorel Nicolae and Bolocan Cristina Halmajan
Current Estimated Value
Home Financials for this Owner
Home Financials are based on the most recent Mortgage that was taken out on this home.
Original Mortgage
$680,000
Outstanding Balance
$669,211
Interest Rate
6.88%
Mortgage Type
New Conventional
Estimated Equity
$310,287
Purchase Details
Closed on
Mar 9, 2017
Sold by
Miguel Moises P San and Miguel Frances M
Bought by
City Of Anaheim
Purchase Details
Closed on
Aug 23, 2002
Sold by
Sanmiguel Jessie P
Bought by
Sanmiguel Moises P and Sanmiguel Frances M
Home Financials for this Owner
Home Financials are based on the most recent Mortgage that was taken out on this home.
Original Mortgage
$140,800
Interest Rate
7.12%
Create a Home Valuation Report for This Property
The Home Valuation Report is an in-depth analysis detailing your home's value as well as a comparison with similar homes in the area
Home Values in the Area
Average Home Value in this Area
Purchase History
| Date | Buyer | Sale Price | Title Company |
|---|---|---|---|
| Halmajan Dorel Nicolae | $800,000 | Homelight Title | |
| City Of Anaheim | -- | None Available | |
| Sanmiguel Moises P | $176,000 | -- |
Source: Public Records
Mortgage History
| Date | Status | Borrower | Loan Amount |
|---|---|---|---|
| Open | Halmajan Dorel Nicolae | $680,000 | |
| Previous Owner | Sanmiguel Moises P | $140,800 | |
| Closed | Sanmiguel Moises P | $35,200 |
Source: Public Records
Tax History Compared to Growth
Tax History
| Year | Tax Paid | Tax Assessment Tax Assessment Total Assessment is a certain percentage of the fair market value that is determined by local assessors to be the total taxable value of land and additions on the property. | Land | Improvement |
|---|---|---|---|---|
| 2025 | $4,906 | $938,400 | $846,600 | $91,800 |
| 2024 | $4,906 | $410,848 | $327,586 | $83,262 |
| 2023 | $4,803 | $402,793 | $321,163 | $81,630 |
| 2022 | $8,053 | $394,896 | $314,866 | $80,030 |
| 2021 | $8,061 | $387,153 | $308,692 | $78,461 |
| 2020 | $7,996 | $383,184 | $305,527 | $77,657 |
| 2019 | $7,856 | $375,671 | $299,536 | $76,135 |
| 2018 | $7,757 | $368,305 | $293,662 | $74,643 |
| 2017 | $7,561 | $361,084 | $287,904 | $73,180 |
| 2016 | $7,694 | $367,034 | $295,558 | $71,476 |
| 2015 | $7,700 | $361,521 | $291,118 | $70,403 |
| 2014 | $4,143 | $354,440 | $285,416 | $69,024 |
Source: Public Records
Map
Nearby Homes
- 615 615 W Romneya
- 1601 W Baker Ave
- 1850 W Orangethorpe Ave
- 1850 W Orangethorpe Ave Unit 25
- 1850 W Orangethorpe Ave Unit 24
- 1850 W Orangethorpe Ave Unit 1
- 1850 W Orangethorpe Ave Unit 44
- 1919 W Coronet Ave Unit 122
- 1919 W Coronet Ave Unit 132
- 1919 W Coronet Ave Unit 75
- 1919 W Coronet Ave
- 1919 W Coronet Ave Unit 208
- 1919 W Coronet Ave Unit 203
- 1919 W Coronet Ave Unit 126
- 1919 W Coronet Ave Unit 221
- 1919 W Coronet Ave Unit 164
- 1919 W Coronet Ave Unit 79
- 1919 W Coronet Ave Unit 143
- 1384 N Schooner Ln Unit 85
- 1746 W Southgate Ave
- 1325 N Catalpa Ave
- 1254 N Brookhurst St
- 1313 N Catalpa Ave
- 1252 N Brookhurst St
- 1309 N Catalpa Ave
- 1327 N Catalpa Ave
- 1246 N Brookhurst St
- 1303 N Catalpa Ave
- 1316 N Catalpa Ave
- 1312 N Catalpa Ave
- 2161 W Coronet Ave
- 1320 N Catalpa Ave
- 2208 W Coronet Ave
- 1310 N Catalpa Ave
- 1243 N Catalpa Ave
- 1242 N Brookhurst St
- 2209 W Coronet Ave
- 2157 W Coronet Ave
- 1302 N Catalpa Ave
- 1313 N Brookhurst St