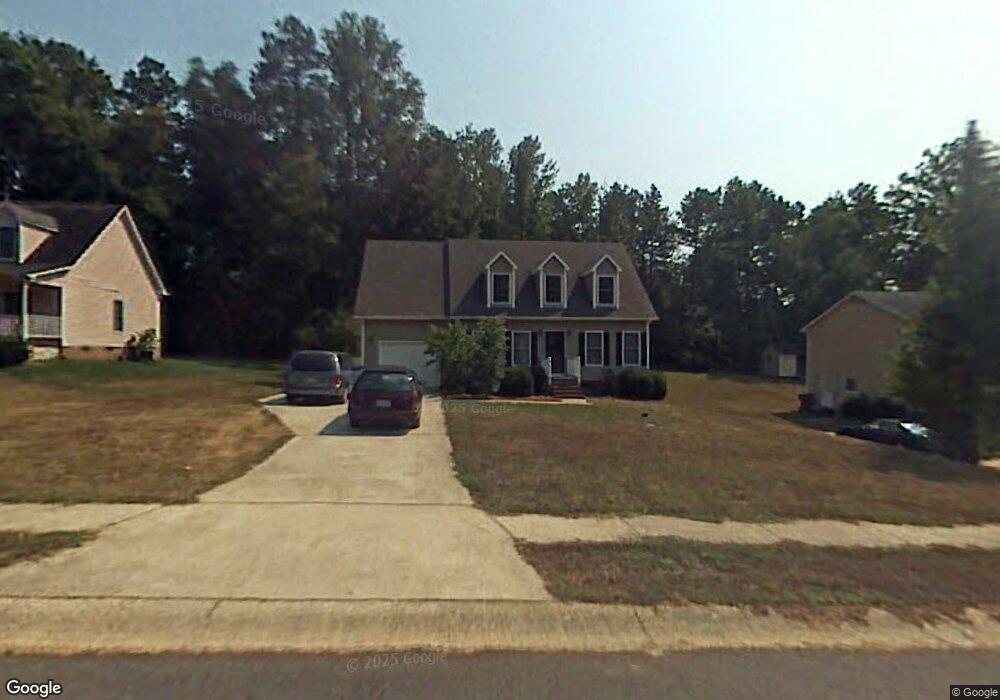
132 Antelope Dr Mount Holly, NC 28120
Estimated Value: $299,000 - $335,000
4
Beds
3
Baths
1,300
Sq Ft
$244/Sq Ft
Est. Value
About This Home
This home is located at 132 Antelope Dr, Mount Holly, NC 28120 and is currently estimated at $317,079, approximately $243 per square foot. 132 Antelope Dr is a home located in Gaston County with nearby schools including Rankin Elementary School, Mount Holly Middle School, and Stuart W. Cramer High School.
Ownership History
Date
Name
Owned For
Owner Type
Purchase Details
Closed on
Aug 10, 2021
Sold by
Park Johnathon Patrick and Park Jordan Hoffman
Bought by
Yamasa Co Ltd
Current Estimated Value
Purchase Details
Closed on
May 24, 2012
Sold by
Secretary Of Housing & Urban Development
Bought by
Park Johnathon Patrick
Home Financials for this Owner
Home Financials are based on the most recent Mortgage that was taken out on this home.
Original Mortgage
$81,632
Interest Rate
3.91%
Mortgage Type
New Conventional
Purchase Details
Closed on
Feb 1, 2012
Sold by
Wright Brian
Bought by
Secretary Of Housing & Urban Development
Purchase Details
Closed on
Aug 25, 2004
Sold by
Rivette Richard Allen and Rivette Dagny Anastasia
Bought by
Wright Brian
Home Financials for this Owner
Home Financials are based on the most recent Mortgage that was taken out on this home.
Original Mortgage
$138,803
Interest Rate
5.97%
Mortgage Type
FHA
Create a Home Valuation Report for This Property
The Home Valuation Report is an in-depth analysis detailing your home's value as well as a comparison with similar homes in the area
Home Values in the Area
Average Home Value in this Area
Purchase History
| Date | Buyer | Sale Price | Title Company |
|---|---|---|---|
| Yamasa Co Ltd | $230,000 | Investors Title Insurance Co | |
| Yamasa Co Ltd | -- | Investors Title | |
| Park Johnathon Patrick | -- | None Available | |
| Secretary Of Housing & Urban Development | $166,817 | None Available | |
| Wright Brian | $140,000 | -- |
Source: Public Records
Mortgage History
| Date | Status | Borrower | Loan Amount |
|---|---|---|---|
| Previous Owner | Park Johnathon Patrick | $81,632 | |
| Previous Owner | Wright Brian | $138,803 |
Source: Public Records
Tax History Compared to Growth
Tax History
| Year | Tax Paid | Tax Assessment Tax Assessment Total Assessment is a certain percentage of the fair market value that is determined by local assessors to be the total taxable value of land and additions on the property. | Land | Improvement |
|---|---|---|---|---|
| 2025 | $2,725 | $271,410 | $28,000 | $243,410 |
| 2024 | $2,725 | $271,410 | $28,000 | $243,410 |
| 2023 | $2,755 | $271,410 | $28,000 | $243,410 |
| 2022 | $2,338 | $180,570 | $24,000 | $156,570 |
| 2021 | $2,375 | $180,570 | $24,000 | $156,570 |
| 2019 | $2,393 | $180,570 | $24,000 | $156,570 |
| 2018 | $1,808 | $129,162 | $22,400 | $106,762 |
| 2017 | $1,808 | $129,162 | $22,400 | $106,762 |
| 2016 | $1,124 | $129,162 | $0 | $0 |
| 2014 | $1,233 | $141,774 | $28,000 | $113,774 |
Source: Public Records
Map
Nearby Homes
- 112 Julia St
- Winslow Plan at Mooreland Oaks
- Huntley Plan at Mooreland Oaks
- Declan Plan at Mooreland Oaks
- Jasper Plan at Mooreland Oaks
- Devin Plan at Mooreland Oaks
- Montcrest Plan at Mooreland Oaks
- Riley Plan at Mooreland Oaks
- Ava Plan at Mooreland Oaks
- TA4000 Plan at Mooreland Oaks
- Kipling Plan at Mooreland Oaks
- Hudson Plan at Mooreland Oaks
- Lenox Plan at Mooreland Oaks
- Bayside Plan at Mooreland Oaks
- Cyprus Plan at Mooreland Oaks
- 5041 Mooreland Oaks Way
- 1029 Old Nc 27 Hwy
- 157 Brookstone Dr
- 160 Brookstone Dr
- 1015 Hoover Ave
- 136 Antelope Dr
- 128 Antelope Dr
- 124 Antelope Dr
- 140 Antelope Dr
- 113 Antelope Dr
- 109 Antelope Dr
- 117 Antelope Dr
- 105 Antelope Dr
- 144 Antelope Dr
- 120 Antelope Dr
- 121 Antelope Dr
- 125 Julia St
- 101 Antelope Dr
- 112 Deertrack Dr
- 108 Deertrack Dr
- 112R Deertrack Dr
- 116 Deertrack Dr
- 104 Deertrack Dr
- 148 Antelope Dr
- 125 Antelope Dr