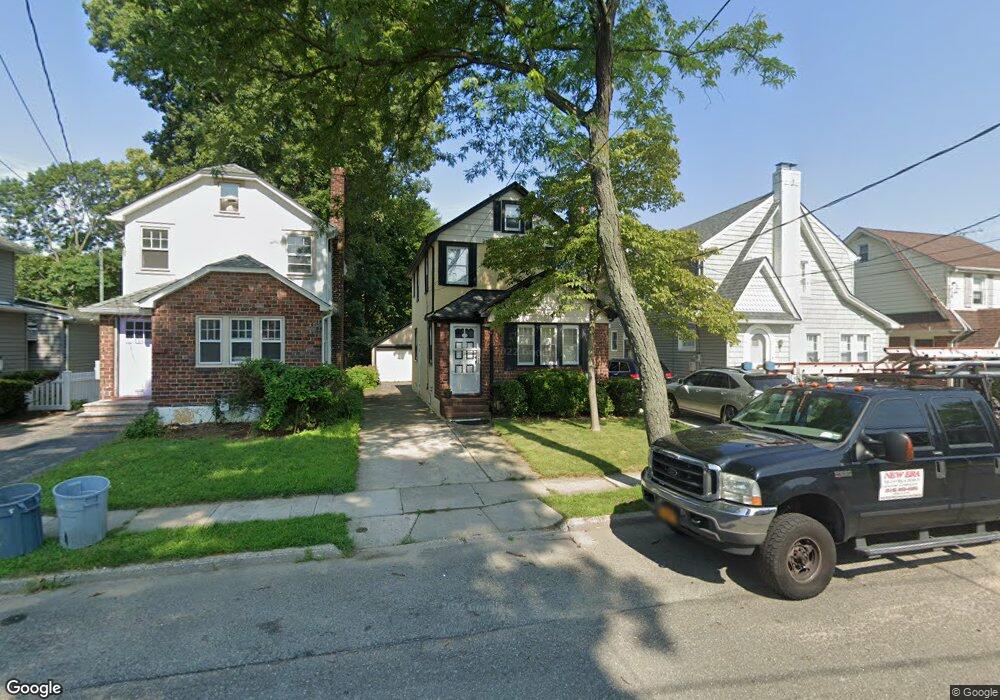
132 Geranium Ave Floral Park, NY 11001
Estimated Value: $800,762 - $864,000
3
Beds
2
Baths
1,112
Sq Ft
$749/Sq Ft
Est. Value
About This Home
This home is located at 132 Geranium Ave, Floral Park, NY 11001 and is currently estimated at $832,381, approximately $748 per square foot. 132 Geranium Ave is a home located in Nassau County with nearby schools including Our Lady Of Victory School and Martin De Porres School.
Ownership History
Date
Name
Owned For
Owner Type
Purchase Details
Closed on
Mar 10, 2020
Sold by
Walsh Christopher T and Walsh Bridget R
Bought by
Nadolny Ronald
Current Estimated Value
Home Financials for this Owner
Home Financials are based on the most recent Mortgage that was taken out on this home.
Original Mortgage
$385,000
Outstanding Balance
$340,322
Interest Rate
3.4%
Mortgage Type
New Conventional
Estimated Equity
$492,059
Purchase Details
Closed on
Jun 20, 2019
Sold by
Glenka James E
Bought by
Walsh Christopher T and Walsh Bridget R
Home Financials for this Owner
Home Financials are based on the most recent Mortgage that was taken out on this home.
Original Mortgage
$456,000
Interest Rate
3.82%
Mortgage Type
New Conventional
Purchase Details
Closed on
Aug 3, 2011
Sold by
Glenka John Marion and Glenka Alice G
Bought by
Glenka Alice G
Purchase Details
Closed on
Nov 6, 2002
Sold by
Wilcar Properties Llc
Bought by
Community Housing Innovat
Create a Home Valuation Report for This Property
The Home Valuation Report is an in-depth analysis detailing your home's value as well as a comparison with similar homes in the area
Home Values in the Area
Average Home Value in this Area
Purchase History
| Date | Buyer | Sale Price | Title Company |
|---|---|---|---|
| Nadolny Ronald | $625,000 | Amtrust Title | |
| Walsh Christopher T | $570,000 | Commonwealth Land Title | |
| Glenka Alice G | -- | -- | |
| Community Housing Innovat | $305,000 | -- |
Source: Public Records
Mortgage History
| Date | Status | Borrower | Loan Amount |
|---|---|---|---|
| Open | Nadolny Ronald | $385,000 | |
| Previous Owner | Walsh Christopher T | $456,000 |
Source: Public Records
Tax History Compared to Growth
Tax History
| Year | Tax Paid | Tax Assessment Tax Assessment Total Assessment is a certain percentage of the fair market value that is determined by local assessors to be the total taxable value of land and additions on the property. | Land | Improvement |
|---|---|---|---|---|
| 2025 | $10,080 | $588 | $350 | $238 |
| 2024 | $1,253 | $588 | $350 | $238 |
| 2023 | $8,824 | $588 | $350 | $238 |
| 2022 | $8,824 | $588 | $350 | $238 |
| 2021 | $11,955 | $573 | $341 | $232 |
| 2020 | $5,077 | $596 | $543 | $53 |
| 2019 | $701 | $596 | $543 | $53 |
| 2018 | $3,950 | $596 | $0 | $0 |
| 2017 | $2,298 | $596 | $543 | $53 |
| 2016 | $2,940 | $596 | $543 | $53 |
| 2015 | $561 | $596 | $543 | $53 |
| 2014 | $561 | $596 | $543 | $53 |
| 2013 | $505 | $596 | $543 | $53 |
Source: Public Records
Map
Nearby Homes
- 103 Calla Ave
- 104 Geranium Ave
- 88 Mayfair Ave
- 345 Plainfield Ave
- 22 Pansy Ave
- 101 W Elder Ave
- 34 Vandewater Ave
- 10 Pansy Ave
- 71 Floral Blvd
- 85 Violet Ave
- 193 Beech St
- 84 Superior Rd
- 1 Childs Ave Unit 1E
- 1 Childs Ave Unit 2E
- 215 W Poplar St
- 138 Carnegie Ave
- 267 Roquette Ave
- 56 Floral Pkwy
- 44 Carnegie Ave
- 40 Carnegie Ave
- 136 Geranium Ave
- 128 Geranium Ave
- 138 Geranium Ave
- 117 Calla Ave
- 124 Geranium Ave
- 142 Geranium Ave
- 115 Calla Ave
- 10 Zinnia Ave
- 111 Calla Ave
- 146 Geranium Ave
- 14 Zinnia Ave
- 131 Geranium Ave
- 135 Geranium Ave
- 137 Geranium Ave
- 116 Geranium Ave
- 143 Geranium Ave
- 107 Calla Ave
- 20 Zinnia Ave
- 150 Geranium Ave
- 147 Geranium Ave