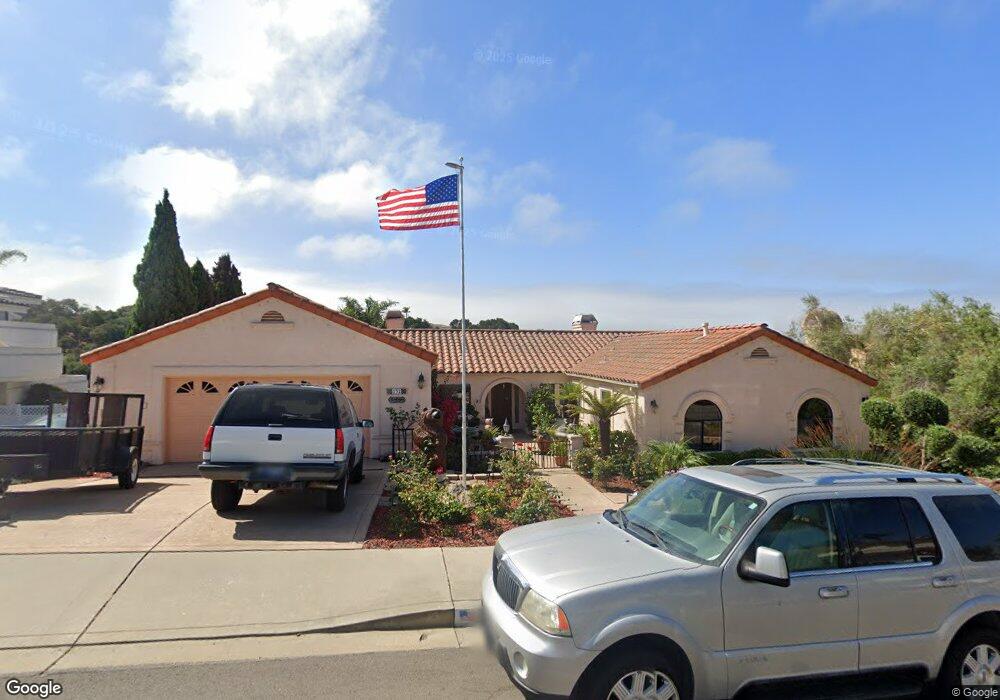
132 La Colima Pismo Beach, CA 93449
Estimated Value: $1,399,825 - $1,747,000
3
Beds
3
Baths
2,813
Sq Ft
$556/Sq Ft
Est. Value
About This Home
This home is located at 132 La Colima, Pismo Beach, CA 93449 and is currently estimated at $1,562,706, approximately $555 per square foot. 132 La Colima is a home located in San Luis Obispo County with nearby schools including Judkins Middle School, Arroyo Grande High School, and Coastal Christian School.
Ownership History
Date
Name
Owned For
Owner Type
Purchase Details
Closed on
Sep 24, 2002
Sold by
Rogers Edward E and Rogers Kathryn C
Bought by
Rogers Edward E and Rogers Kathryn C
Current Estimated Value
Home Financials for this Owner
Home Financials are based on the most recent Mortgage that was taken out on this home.
Original Mortgage
$413,500
Outstanding Balance
$163,382
Interest Rate
5.5%
Estimated Equity
$1,399,324
Purchase Details
Closed on
Mar 6, 2002
Sold by
Rogers Edward E and Rogers Kathryn C
Bought by
Rogers Edward E and Rogers Kathryn C
Purchase Details
Closed on
Feb 16, 1994
Sold by
Porter Millard and Porter Mary
Bought by
Rogers Edward E and Rogers Kathryn C
Home Financials for this Owner
Home Financials are based on the most recent Mortgage that was taken out on this home.
Original Mortgage
$255,000
Interest Rate
8.1%
Create a Home Valuation Report for This Property
The Home Valuation Report is an in-depth analysis detailing your home's value as well as a comparison with similar homes in the area
Home Values in the Area
Average Home Value in this Area
Purchase History
| Date | Buyer | Sale Price | Title Company |
|---|---|---|---|
| Rogers Edward E | -- | Alliance Title Company | |
| Rogers Edward E | -- | First American Title Company | |
| Rogers Edward E | -- | -- | |
| Rogers Edward E | $340,000 | First American Title Ins Co |
Source: Public Records
Mortgage History
| Date | Status | Borrower | Loan Amount |
|---|---|---|---|
| Open | Rogers Edward E | $413,500 | |
| Previous Owner | Rogers Edward E | $255,000 |
Source: Public Records
Tax History Compared to Growth
Tax History
| Year | Tax Paid | Tax Assessment Tax Assessment Total Assessment is a certain percentage of the fair market value that is determined by local assessors to be the total taxable value of land and additions on the property. | Land | Improvement |
|---|---|---|---|---|
| 2025 | $6,063 | $571,054 | $235,137 | $335,917 |
| 2024 | $5,988 | $559,858 | $230,527 | $329,331 |
| 2023 | $5,988 | $548,881 | $226,007 | $322,874 |
| 2022 | $5,893 | $538,120 | $221,576 | $316,544 |
| 2021 | $5,874 | $527,570 | $217,232 | $310,338 |
| 2020 | $5,804 | $522,161 | $215,005 | $307,156 |
| 2019 | $5,758 | $511,924 | $210,790 | $301,134 |
| 2018 | $5,685 | $501,887 | $206,657 | $295,230 |
| 2017 | $5,587 | $492,047 | $202,605 | $289,442 |
| 2016 | $5,282 | $482,400 | $198,633 | $283,767 |
| 2015 | $5,210 | $475,155 | $195,650 | $279,505 |
| 2014 | $5,022 | $465,848 | $191,818 | $274,030 |
Source: Public Records
Map
Nearby Homes
- 45 La Gaviota
- 2 Paseo Ladera Ln
- 60 La Garza
- 601 Vista Pacifica Cir
- 747 Vista Pacifica Cir
- 618 Vista Pacifica Cir
- 657 Vista Pacifica Cir
- 670 Vista Pacifica Cir
- 762 White Oak Blvd
- 170 Surf St
- 207 Princessa Ln
- 201 Miguelito Ln
- 201 Five Cities Dr Unit 100
- 234 Christine Way
- 115 Fairview Ln
- 175 Clydell Ct
- 834 N 5th St
- 1032 Margarita
- 108 Marian Way
- 249 Margo Way
- 128 La Colima
- 136 La Colima
- 131 La Colima
- 127 La Colima
- 124 La Colima
- 123 La Colima
- 140 La Puesta Del Sol
- 144 La Puesta Del Sol
- 120 La Colima
- 146 La Floricita
- 142 La Floricita
- 148 La Puesta Del Sol
- 138 La Floricita
- 119 La Colima
- 150 La Puesta Del Sol
- 134 La Floricita
- 115 La Colima
- 154 La Puesta Del Sol
- 143 La Floricita