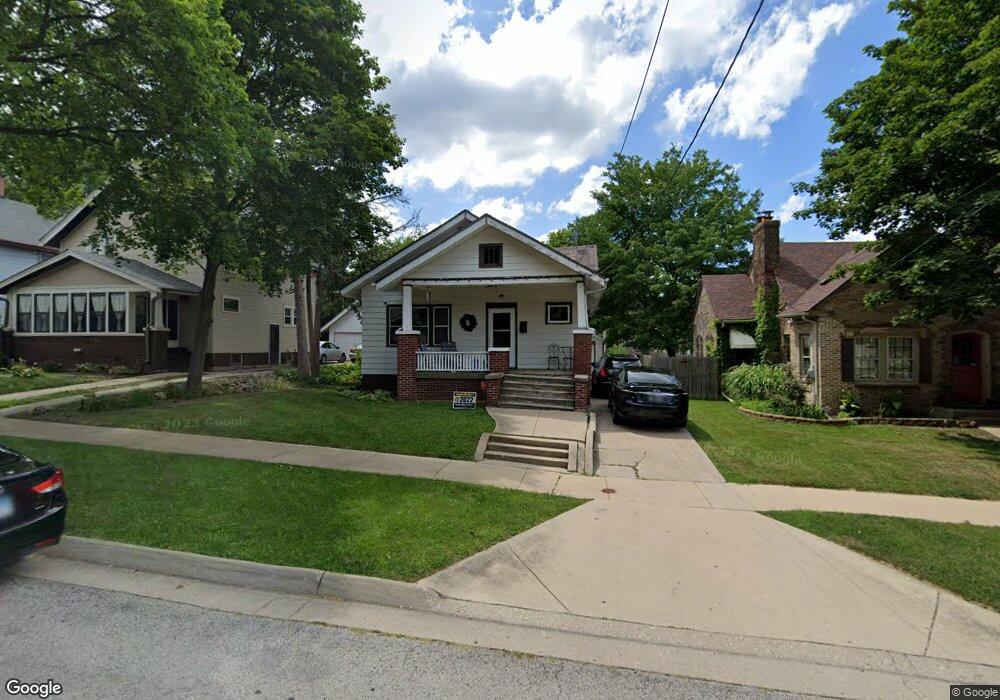
132 N Chicago Ave Rockford, IL 61107
North Highland NeighborhoodEstimated Value: $129,000 - $160,972
5
Beds
1
Bath
1,736
Sq Ft
$80/Sq Ft
Est. Value
About This Home
This home is located at 132 N Chicago Ave, Rockford, IL 61107 and is currently estimated at $139,493, approximately $80 per square foot. 132 N Chicago Ave is a home located in Winnebago County with nearby schools including Bloom Elementary School, Abraham Lincoln Middle School, and Rockford East High School.
Ownership History
Date
Name
Owned For
Owner Type
Purchase Details
Closed on
Nov 22, 2024
Sold by
Skyward Holdings Llc
Bought by
Horizon Group Holdings Llc
Current Estimated Value
Home Financials for this Owner
Home Financials are based on the most recent Mortgage that was taken out on this home.
Original Mortgage
$90,000
Outstanding Balance
$76,933
Interest Rate
6.44%
Mortgage Type
New Conventional
Estimated Equity
$62,560
Purchase Details
Closed on
Jan 18, 2022
Sold by
Hub City Investments Llc
Bought by
Skyward Holdings Llc
Home Financials for this Owner
Home Financials are based on the most recent Mortgage that was taken out on this home.
Original Mortgage
$907,500
Interest Rate
2.62%
Mortgage Type
New Conventional
Purchase Details
Closed on
Oct 9, 2018
Sold by
American Cap Finl Grp
Bought by
Hub City Investments Llc
Purchase Details
Closed on
Oct 6, 2018
Sold by
American Capital Financial Group Llc
Bought by
Hub City Investments Llc
Purchase Details
Closed on
Aug 30, 2005
Bought by
Asija Rajni
Create a Home Valuation Report for This Property
The Home Valuation Report is an in-depth analysis detailing your home's value as well as a comparison with similar homes in the area
Home Values in the Area
Average Home Value in this Area
Purchase History
| Date | Buyer | Sale Price | Title Company |
|---|---|---|---|
| Horizon Group Holdings Llc | $120,000 | None Listed On Document | |
| Horizon Group Holdings Llc | $120,000 | None Listed On Document | |
| Skyward Holdings Llc | $1,210,000 | Hewitt & Wagner | |
| Hub City Investments Llc | $280,000 | Mta | |
| Hub City Investments Llc | $280,000 | Law Offices Of Neil S Zweiban | |
| American Capital Financial Group Llc | -- | Law Offices Of Neil S Zweiban | |
| American Capital Financial Gro | -- | Law Offices Of Neil S Zweiban | |
| Asija Rajni | $109,900 | -- |
Source: Public Records
Mortgage History
| Date | Status | Borrower | Loan Amount |
|---|---|---|---|
| Open | Horizon Group Holdings Llc | $90,000 | |
| Closed | Horizon Group Holdings Llc | $90,000 | |
| Previous Owner | Skyward Holdings Llc | $907,500 |
Source: Public Records
Tax History Compared to Growth
Tax History
| Year | Tax Paid | Tax Assessment Tax Assessment Total Assessment is a certain percentage of the fair market value that is determined by local assessors to be the total taxable value of land and additions on the property. | Land | Improvement |
|---|---|---|---|---|
| 2024 | $4,164 | $43,936 | $5,830 | $38,106 |
| 2023 | $4,023 | $38,741 | $5,141 | $33,600 |
| 2022 | $3,271 | $34,627 | $4,595 | $30,032 |
| 2021 | $3,156 | $31,750 | $4,213 | $27,537 |
| 2020 | $3,088 | $30,015 | $3,983 | $26,032 |
| 2019 | $3,832 | $28,607 | $3,796 | $24,811 |
| 2018 | $3,860 | $26,960 | $3,578 | $23,382 |
| 2017 | $3,828 | $25,801 | $3,424 | $22,377 |
| 2016 | $3,825 | $25,318 | $3,360 | $21,958 |
| 2015 | $3,873 | $25,318 | $3,360 | $21,958 |
| 2014 | $4,215 | $27,068 | $4,209 | $22,859 |
Source: Public Records
Map
Nearby Homes
- 234 N Gardiner Ave
- 131 S Chicago Ave
- 410 N Chicago Ave
- 121 Paris Ave
- 226 Rome Ave
- 1602 E State St
- 224 S Prospect St
- 120 Smith Ave
- 120 Smith Ave Unit 122
- 504 Paris Ave
- 224 N Rockford Ave
- 206 12th St
- 408 S Gardiner Ave
- 320 Shaw St
- 422 N Rockford Ave
- 1722 Charles St
- 2322 E State St
- 1822 Charles St
- 1519 Jackson St
- 335 Saint Louis Ave
- 136 N Chicago Ave
- 126 N Chicago Ave
- 208 N Chicago Ave
- 122 N Chicago Ave
- 127 N Highland Ave
- 212 N Chicago Ave
- 116 N Chicago Ave
- 203 N Highland Ave
- 123 N Highland Ave
- 209 N Highland Ave
- 218 N Chicago Ave
- 117 N Highland Ave
- 131 N Chicago Ave
- 123 N Chicago Ave
- 135 N Chicago Ave
- 213 N Highland Ave
- 121 N Chicago Ave
- 137 N Chicago Ave
- 222 N Chicago Ave
- 211 N Chicago Ave