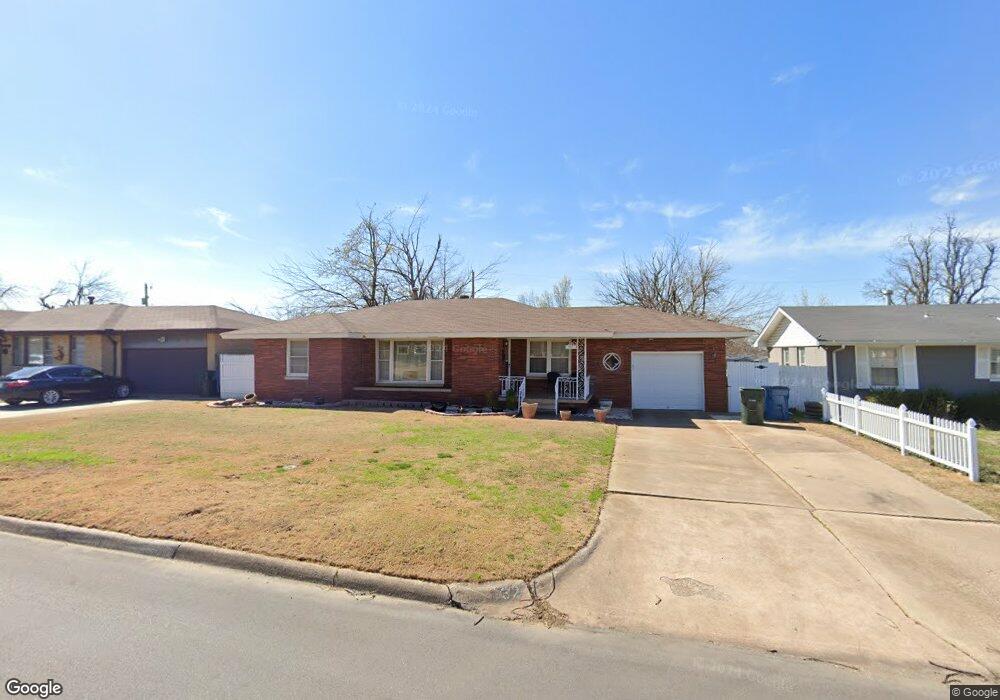
132 W Jarman Dr Oklahoma City, OK 73110
Estimated Value: $121,000 - $153,000
2
Beds
2
Baths
1,195
Sq Ft
$119/Sq Ft
Est. Value
About This Home
This home is located at 132 W Jarman Dr, Oklahoma City, OK 73110 and is currently estimated at $142,527, approximately $119 per square foot. 132 W Jarman Dr is a home located in Oklahoma County with nearby schools including Country Estates Elementary School, Midwest City Middle School, and Midwest City High School.
Ownership History
Date
Name
Owned For
Owner Type
Purchase Details
Closed on
Jun 13, 2023
Sold by
Sb Home Buyers
Bought by
Sb Home Buyers
Current Estimated Value
Purchase Details
Closed on
Jun 14, 2012
Sold by
Wheeler Dallas
Bought by
Mckay Alicia G
Home Financials for this Owner
Home Financials are based on the most recent Mortgage that was taken out on this home.
Original Mortgage
$57,000
Outstanding Balance
$39,503
Interest Rate
3.83%
Mortgage Type
New Conventional
Estimated Equity
$103,024
Purchase Details
Closed on
May 8, 2012
Sold by
Edwards Sheila
Bought by
Edwards Family Revocable Trust
Home Financials for this Owner
Home Financials are based on the most recent Mortgage that was taken out on this home.
Original Mortgage
$57,000
Outstanding Balance
$39,503
Interest Rate
3.83%
Mortgage Type
New Conventional
Estimated Equity
$103,024
Purchase Details
Closed on
Apr 28, 2004
Sold by
Cummings Kenneth R and Cummings David P
Bought by
Skinner Katherine L
Create a Home Valuation Report for This Property
The Home Valuation Report is an in-depth analysis detailing your home's value as well as a comparison with similar homes in the area
Home Values in the Area
Average Home Value in this Area
Purchase History
| Date | Buyer | Sale Price | Title Company |
|---|---|---|---|
| Sb Home Buyers | $45,000 | None Listed On Document | |
| Mckay Alicia G | $60,000 | None Available | |
| Edwards Family Revocable Trust | -- | None Available | |
| Skinner Katherine L | $47,500 | Stewart Escrow & Title Midwe |
Source: Public Records
Mortgage History
| Date | Status | Borrower | Loan Amount |
|---|---|---|---|
| Open | Mckay Alicia G | $57,000 |
Source: Public Records
Tax History Compared to Growth
Tax History
| Year | Tax Paid | Tax Assessment Tax Assessment Total Assessment is a certain percentage of the fair market value that is determined by local assessors to be the total taxable value of land and additions on the property. | Land | Improvement |
|---|---|---|---|---|
| 2024 | $1,214 | $14,190 | $3,141 | $11,049 |
| 2023 | $1,214 | $10,314 | $1,748 | $8,566 |
| 2022 | $1,146 | $9,822 | $1,847 | $7,975 |
| 2021 | $1,117 | $9,355 | $2,043 | $7,312 |
| 2020 | $1,094 | $8,910 | $2,162 | $6,748 |
| 2019 | $1,086 | $9,240 | $1,928 | $7,312 |
| 2018 | $970 | $8,800 | $0 | $0 |
| 2017 | $985 | $8,799 | $1,940 | $6,859 |
| 2016 | $987 | $8,579 | $1,940 | $6,639 |
| 2015 | $1,029 | $8,589 | $2,071 | $6,518 |
| 2014 | $1,035 | $8,647 | $2,071 | $6,576 |
Source: Public Records
Map
Nearby Homes
- 136 W Jarman Dr
- 128 W Jarman Dr
- 137 W Steed Dr
- 200 W Jarman Dr
- 124 W Jarman Dr
- 129 W Steed Dr
- 133 W Jarman Dr
- 137 W Jarman Dr
- 129 W Jarman Dr
- 204 W Jarman Dr
- 125 W Steed Dr
- 120 W Jarman Dr
- 201 W Jarman Dr
- 125 W Jarman Dr
- 121 W Steed Dr
- 205 W Steed Dr
- 205 W Jarman Dr
- 208 W Jarman Dr
- 121 W Jarman Dr
- 116 W Jarman Dr