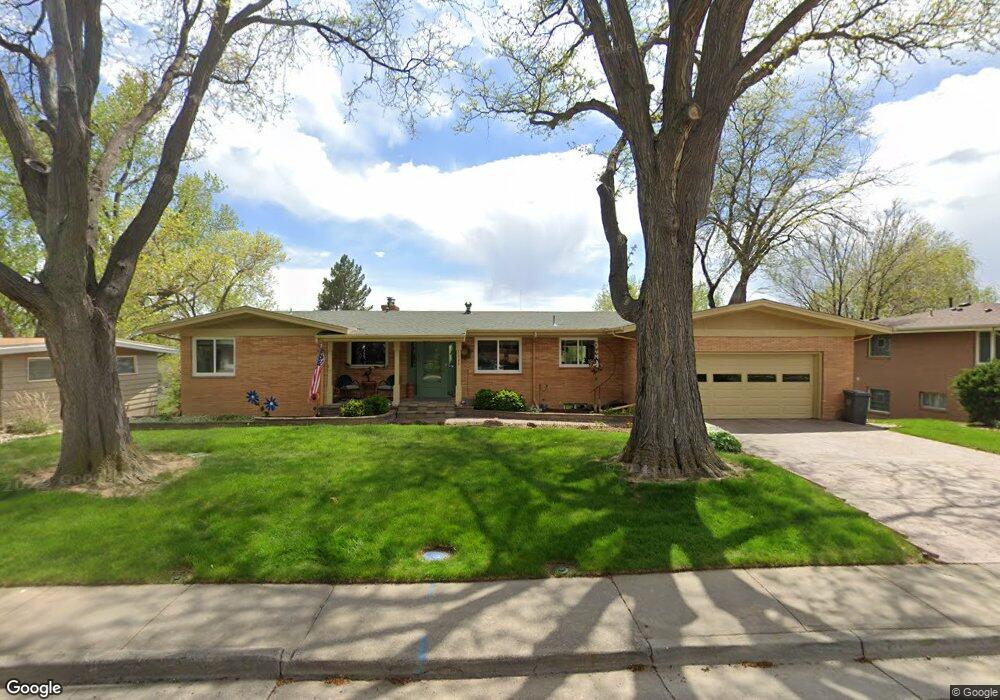
1320 W 6th St Loveland, CO 80537
Estimated Value: $575,275 - $703,000
3
Beds
2
Baths
1,761
Sq Ft
$353/Sq Ft
Est. Value
About This Home
This home is located at 1320 W 6th St, Loveland, CO 80537 and is currently estimated at $622,319, approximately $353 per square foot. 1320 W 6th St is a home located in Larimer County with nearby schools including Garfield Elementary School, Bill Reed Middle School, and Loveland High School.
Ownership History
Date
Name
Owned For
Owner Type
Purchase Details
Closed on
Jul 12, 2017
Sold by
Mullinix Ralph K
Bought by
Mullinix Ralph K
Current Estimated Value
Purchase Details
Closed on
Oct 15, 2012
Sold by
Ralph K Mullinix Trust
Bought by
Mullinix Ralph K
Home Financials for this Owner
Home Financials are based on the most recent Mortgage that was taken out on this home.
Original Mortgage
$130,000
Outstanding Balance
$21,577
Interest Rate
2.88%
Mortgage Type
New Conventional
Estimated Equity
$600,742
Purchase Details
Closed on
Oct 26, 2004
Sold by
Mullinix Ralph K
Bought by
Ralph K Mullinix Trust
Purchase Details
Closed on
Nov 19, 1996
Sold by
Clagett John M
Bought by
Mullinix Ralph K
Home Financials for this Owner
Home Financials are based on the most recent Mortgage that was taken out on this home.
Original Mortgage
$195,700
Interest Rate
7.84%
Mortgage Type
VA
Create a Home Valuation Report for This Property
The Home Valuation Report is an in-depth analysis detailing your home's value as well as a comparison with similar homes in the area
Home Values in the Area
Average Home Value in this Area
Purchase History
| Date | Buyer | Sale Price | Title Company |
|---|---|---|---|
| Mullinix Ralph K | -- | None Available | |
| Mullinix Ralph K | -- | Assured Title | |
| Ralph K Mullinix Trust | -- | -- | |
| Mullinix Ralph K | $190,000 | -- |
Source: Public Records
Mortgage History
| Date | Status | Borrower | Loan Amount |
|---|---|---|---|
| Open | Mullinix Ralph K | $130,000 | |
| Closed | Mullinix Ralph K | $195,700 |
Source: Public Records
Tax History Compared to Growth
Tax History
| Year | Tax Paid | Tax Assessment Tax Assessment Total Assessment is a certain percentage of the fair market value that is determined by local assessors to be the total taxable value of land and additions on the property. | Land | Improvement |
|---|---|---|---|---|
| 2025 | $2,521 | $41,976 | $4,087 | $37,889 |
| 2024 | $2,432 | $41,976 | $4,087 | $37,889 |
| 2022 | $2,017 | $32,304 | $4,240 | $28,064 |
| 2021 | $2,073 | $33,234 | $4,362 | $28,872 |
| 2020 | $1,992 | $32,197 | $4,362 | $27,835 |
| 2019 | $1,958 | $32,197 | $4,362 | $27,835 |
| 2018 | $1,604 | $26,690 | $4,392 | $22,298 |
| 2017 | $1,381 | $26,690 | $4,392 | $22,298 |
| 2016 | $1,175 | $23,984 | $4,856 | $19,128 |
| 2015 | $1,166 | $23,990 | $4,860 | $19,130 |
| 2014 | $853 | $19,310 | $4,860 | $14,450 |
Source: Public Records
Map
Nearby Homes
- 1330 W 6th St
- 1404 W 6th St
- 1667 Taft Gardens Cir
- 914 W 6th St
- 1658 Taft Gardens Cir
- 1714 W 8th St
- 610 California Ave
- 1100 Taft Ave Unit 46
- 1100 Taft Ave
- 1100 N Taft Ave Unit 27
- 901 W Kelly Dr
- 680 Colorado Ave
- 1016 Winona Cir
- 1205 Loch Mount Dr
- 633 W 6th St
- 1725 Keyes Ct
- 610 W 5th St
- 604 W 9th St
- 643 W 10th St
- 720 Roosevelt Ave