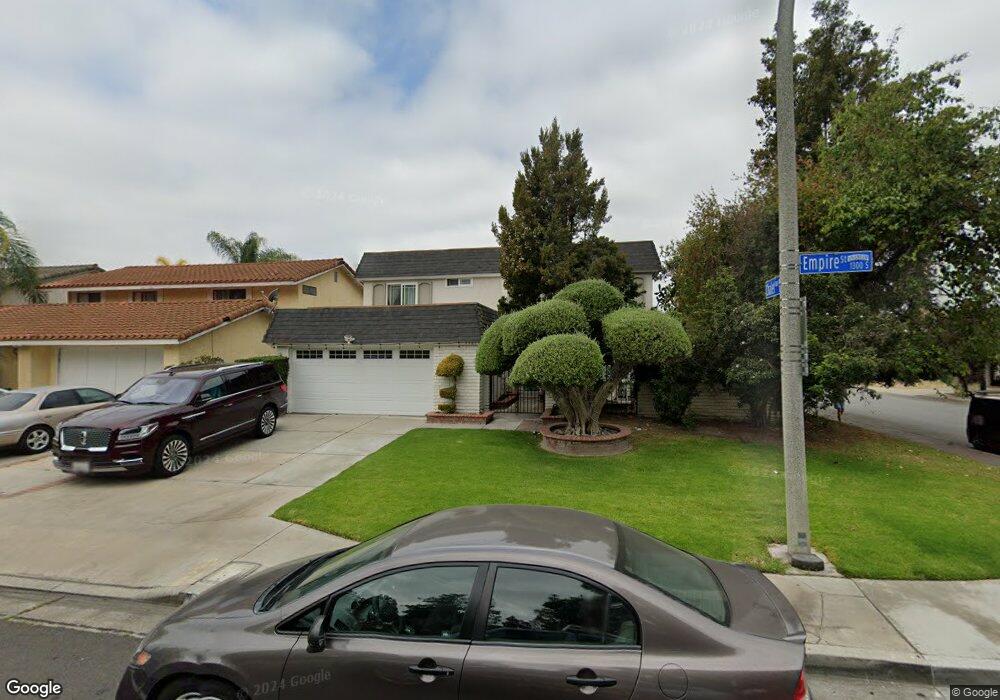
1321 S Empire St Anaheim, CA 92804
West Anaheim NeighborhoodEstimated Value: $1,045,000 - $1,389,000
4
Beds
3
Baths
2,160
Sq Ft
$556/Sq Ft
Est. Value
About This Home
This home is located at 1321 S Empire St, Anaheim, CA 92804 and is currently estimated at $1,200,736, approximately $555 per square foot. 1321 S Empire St is a home located in Orange County with nearby schools including James Madison Elementary School, Ball Junior High School, and Loara High School.
Ownership History
Date
Name
Owned For
Owner Type
Purchase Details
Closed on
Sep 2, 2020
Sold by
Tran Ngoc Bich
Bought by
Do Tina
Current Estimated Value
Home Financials for this Owner
Home Financials are based on the most recent Mortgage that was taken out on this home.
Original Mortgage
$410,500
Outstanding Balance
$363,463
Interest Rate
2.9%
Mortgage Type
New Conventional
Estimated Equity
$837,273
Purchase Details
Closed on
Aug 13, 2020
Sold by
Le Bryant T and Do Tina
Bought by
Le Bryant T and Nguyen Tran Thuy
Home Financials for this Owner
Home Financials are based on the most recent Mortgage that was taken out on this home.
Original Mortgage
$410,500
Outstanding Balance
$363,463
Interest Rate
2.9%
Mortgage Type
New Conventional
Estimated Equity
$837,273
Purchase Details
Closed on
Aug 17, 2006
Sold by
Le Bryan
Bought by
Le Bryan and Do Tina
Purchase Details
Closed on
Dec 24, 2001
Sold by
Lee Dai Youn and Lee Kyung Ja
Bought by
Le Bryan
Home Financials for this Owner
Home Financials are based on the most recent Mortgage that was taken out on this home.
Original Mortgage
$264,000
Interest Rate
7.15%
Create a Home Valuation Report for This Property
The Home Valuation Report is an in-depth analysis detailing your home's value as well as a comparison with similar homes in the area
Home Values in the Area
Average Home Value in this Area
Purchase History
| Date | Buyer | Sale Price | Title Company |
|---|---|---|---|
| Do Tina | -- | Pacific Coast Title | |
| Le Bryant T | -- | Pacific Coast Title | |
| Le Bryan | -- | None Available | |
| Le Bryan | $330,000 | South Coast Title Company |
Source: Public Records
Mortgage History
| Date | Status | Borrower | Loan Amount |
|---|---|---|---|
| Open | Le Bryant T | $410,500 | |
| Previous Owner | Le Bryan | $264,000 |
Source: Public Records
Tax History Compared to Growth
Tax History
| Year | Tax Paid | Tax Assessment Tax Assessment Total Assessment is a certain percentage of the fair market value that is determined by local assessors to be the total taxable value of land and additions on the property. | Land | Improvement |
|---|---|---|---|---|
| 2025 | $6,227 | $548,787 | $351,089 | $197,698 |
| 2024 | $6,227 | $538,027 | $344,205 | $193,822 |
| 2023 | $6,096 | $527,478 | $337,456 | $190,022 |
| 2022 | $6,019 | $517,136 | $330,839 | $186,297 |
| 2021 | $6,029 | $506,997 | $324,352 | $182,645 |
| 2020 | $5,364 | $445,756 | $259,507 | $186,249 |
| 2019 | $5,202 | $437,016 | $254,418 | $182,598 |
| 2018 | $5,093 | $428,448 | $249,430 | $179,018 |
| 2017 | $4,891 | $420,048 | $244,540 | $175,508 |
| 2016 | $4,876 | $411,812 | $239,745 | $172,067 |
| 2015 | $4,833 | $405,627 | $236,144 | $169,483 |
| 2014 | $4,533 | $397,682 | $231,518 | $166,164 |
Source: Public Records
Map
Nearby Homes
- 1350 S Ashington Ln
- 1250 S Brookhurst St Unit 1059
- 1250 S Brookhurst St Unit 2028
- 1250 S Brookhurst St Unit 2080
- 1250 S Brookhurst St
- 1250 S Brookhurst St Unit 2033
- 1944 W Lullaby Ln
- 930 S Emerald St
- 10301 Antigua St
- 1913 W Beacon Ave
- 994 S Sutter Creek Rd Unit 60
- 938 S Sutter Creek Rd Unit 54
- 917 S Sutter Creek Rd Unit 46
- 10301 Rhiems Rd
- 998 S Crossbow Ln Unit 12D
- 958 S Crossbow Ln Unit 8
- 2131 W Niobe Ave
- 1768 W Juno Ave
- 2011 W Katella Ave Unit 61
- 1805 W Chateau Ave
- 1325 S Empire St
- 1320 S Ashington Ln
- 1329 S Empire St
- 1324 S Ashington Ln
- 2101 W Chalet Ave
- 2105 W Chalet Ave
- 1328 S Ashington Ln
- 1333 S Empire St
- 2107 W Chalet Ave
- 1332 S Ashington Ln
- 2109 W Chalet Ave
- 1337 S Empire St
- 2111 W Chalet Ave
- 1336 S Ashington Ln
- 2112 W Chalet Ave
- 2102 W Grace Ct
- 2104 W Grace Ct
- 2106 W Grace Ct
- 2113 W Chalet Ave
- 2108 W Grace Ct