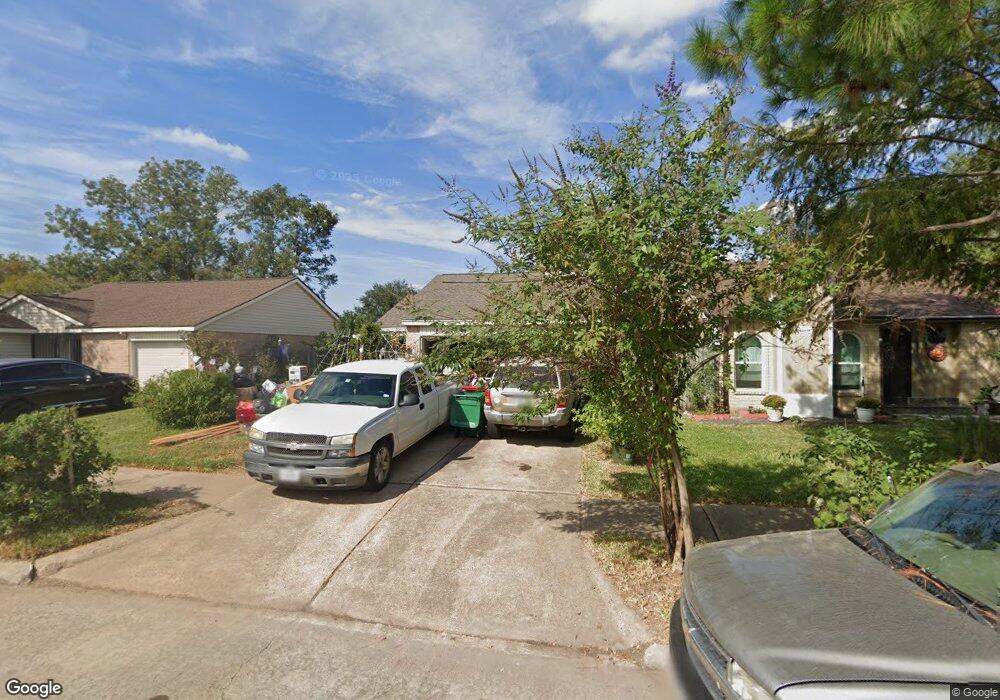
13210 Pebblewalk Cir S Houston, TX 77041
Hearthstone NeighborhoodEstimated Value: $198,000 - $220,000
2
Beds
1
Bath
1,171
Sq Ft
$179/Sq Ft
Est. Value
About This Home
This home is located at 13210 Pebblewalk Cir S, Houston, TX 77041 and is currently estimated at $209,693, approximately $179 per square foot. 13210 Pebblewalk Cir S is a home located in Harris County with nearby schools including Hairgrove Elementary School, Labay Middle School, and Cypress Falls High School.
Ownership History
Date
Name
Owned For
Owner Type
Purchase Details
Closed on
Jan 12, 2007
Sold by
Cubas Marcos W and Cubas Marieta Del C
Bought by
Fernandez Pedro
Current Estimated Value
Home Financials for this Owner
Home Financials are based on the most recent Mortgage that was taken out on this home.
Original Mortgage
$90,630
Outstanding Balance
$53,798
Interest Rate
6.09%
Mortgage Type
Purchase Money Mortgage
Estimated Equity
$155,895
Purchase Details
Closed on
Dec 28, 1994
Sold by
Underwood Charles Francis
Bought by
Cubas Marcos W and Cubas Marieta Del C
Home Financials for this Owner
Home Financials are based on the most recent Mortgage that was taken out on this home.
Original Mortgage
$40,150
Interest Rate
9.19%
Mortgage Type
FHA
Create a Home Valuation Report for This Property
The Home Valuation Report is an in-depth analysis detailing your home's value as well as a comparison with similar homes in the area
Home Values in the Area
Average Home Value in this Area
Purchase History
| Date | Buyer | Sale Price | Title Company |
|---|---|---|---|
| Fernandez Pedro | -- | Chicago Title Cypress | |
| Cubas Marcos W | -- | Regency Title |
Source: Public Records
Mortgage History
| Date | Status | Borrower | Loan Amount |
|---|---|---|---|
| Open | Fernandez Pedro | $90,630 | |
| Previous Owner | Cubas Marcos W | $40,150 |
Source: Public Records
Tax History Compared to Growth
Tax History
| Year | Tax Paid | Tax Assessment Tax Assessment Total Assessment is a certain percentage of the fair market value that is determined by local assessors to be the total taxable value of land and additions on the property. | Land | Improvement |
|---|---|---|---|---|
| 2025 | $2,127 | $208,643 | $71,771 | $136,872 |
| 2024 | $2,127 | $222,523 | $71,771 | $150,752 |
| 2023 | $2,127 | $207,910 | $51,577 | $156,333 |
| 2022 | $4,734 | $194,636 | $39,570 | $155,066 |
| 2021 | $4,551 | $161,908 | $39,570 | $122,338 |
| 2020 | $4,380 | $150,181 | $28,654 | $121,527 |
| 2019 | $4,106 | $142,073 | $20,172 | $121,901 |
| 2018 | $1,066 | $130,073 | $20,172 | $109,901 |
| 2017 | $3,406 | $119,025 | $20,172 | $98,853 |
| 2016 | $3,096 | $107,357 | $20,172 | $87,185 |
| 2015 | $2,041 | $93,692 | $13,372 | $80,320 |
| 2014 | $2,041 | $84,548 | $8,386 | $76,162 |
Source: Public Records
Map
Nearby Homes
- 13215 Vista Oro Dr
- 13219 Vista Brook Dr
- 7530 Lemma Dr
- 13322 Chaston Dr
- 13323 Firebrick Dr
- 7635 Log Cradle Dr
- 7402 Burkridge Dr
- 13202 Chasworth Dr
- 7511 Weatherhill Ln
- 7315 Weatherhill Ln
- 13122 Eldridge Chase
- 7607 Wovenwood Ln
- 7823 Autumn Hollow Ln
- 13814 Swan Hollow Ln
- 13811 Brannon Field Ln
- 7315 Millbrae Ln
- 13826 Swan Hollow Ln
- 7618 Mauna Kai Dr
- 7310 Blenheim Palace Ln
- 14410 Muirfield Ln
- 13206 Pebblewalk Cir S
- 13214 Pebblewalk Cir S
- 13202 Pebblewalk Cir S
- 13211 Pebblewalk Cir N
- 13215 Pebblewalk Cir N
- 13178 Pebblewalk Cir S
- 13219 Pebblewalk Cir N
- 13203 Pebblewalk Cir N
- 13222 Pebblewalk Cir S
- 13211 Pebblewalk Cir S
- 13207 Pebblewalk Cir S
- 13215 Pebblewalk Cir S
- 13147 Pebblewalk Cir N
- 13223 Pebblewalk Cir N
- 13203 Pebblewalk Cir S
- 13219 Pebblewalk Cir S
- 13174 Pebblewalk Cir S
- 13179 Pebblewalk Cir S
- 13223 Pebblewalk Cir S
- 13170 Pebblewalk Cir S