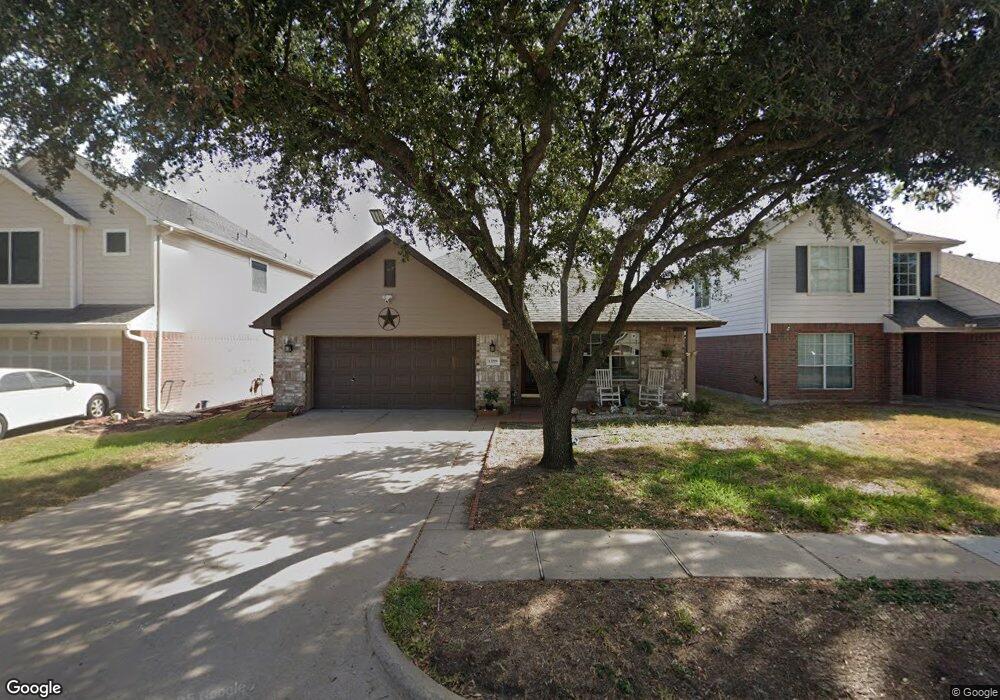
13219 Eldridge Chase Houston, TX 77041
Hearthstone NeighborhoodEstimated Value: $243,000 - $287,000
3
Beds
2
Baths
1,550
Sq Ft
$171/Sq Ft
Est. Value
About This Home
This home is located at 13219 Eldridge Chase, Houston, TX 77041 and is currently estimated at $264,716, approximately $170 per square foot. 13219 Eldridge Chase is a home located in Harris County with nearby schools including Hairgrove Elementary School, Labay Middle School, and Cypress Falls High School.
Ownership History
Date
Name
Owned For
Owner Type
Purchase Details
Closed on
Jan 5, 2005
Sold by
Wilbur Stacy L
Bought by
Zetino Carlos
Current Estimated Value
Home Financials for this Owner
Home Financials are based on the most recent Mortgage that was taken out on this home.
Original Mortgage
$91,920
Outstanding Balance
$51,218
Interest Rate
7.35%
Mortgage Type
Purchase Money Mortgage
Estimated Equity
$213,498
Purchase Details
Closed on
Jun 23, 2004
Sold by
Magee Brent K
Bought by
Wilbur Stacy L
Purchase Details
Closed on
Jan 26, 2001
Sold by
Lennar Homes Of Texas Inc
Bought by
Wilbur Stacy L and Magee Brent K
Home Financials for this Owner
Home Financials are based on the most recent Mortgage that was taken out on this home.
Original Mortgage
$106,925
Interest Rate
7.13%
Create a Home Valuation Report for This Property
The Home Valuation Report is an in-depth analysis detailing your home's value as well as a comparison with similar homes in the area
Home Values in the Area
Average Home Value in this Area
Purchase History
| Date | Buyer | Sale Price | Title Company |
|---|---|---|---|
| Zetino Carlos | -- | Alamo Title Company | |
| Wilbur Stacy L | -- | -- | |
| Wilbur Stacy L | -- | Regency Title Company | |
| Lennar Homes Of Texas Sales & Mktg Ltd | -- | Regency Title Company |
Source: Public Records
Mortgage History
| Date | Status | Borrower | Loan Amount |
|---|---|---|---|
| Open | Zetino Carlos | $91,920 | |
| Previous Owner | Wilbur Stacy L | $106,925 | |
| Closed | Zetino Carlos | $22,980 |
Source: Public Records
Tax History Compared to Growth
Tax History
| Year | Tax Paid | Tax Assessment Tax Assessment Total Assessment is a certain percentage of the fair market value that is determined by local assessors to be the total taxable value of land and additions on the property. | Land | Improvement |
|---|---|---|---|---|
| 2025 | $2,770 | $273,379 | $71,799 | $201,580 |
| 2024 | $2,770 | $316,766 | $71,799 | $244,967 |
| 2023 | $2,770 | $304,737 | $51,597 | $253,140 |
| 2022 | $5,680 | $263,714 | $39,585 | $224,129 |
| 2021 | $5,461 | $216,008 | $39,585 | $176,423 |
| 2020 | $5,164 | $206,382 | $28,665 | $177,717 |
| 2019 | $4,842 | $160,550 | $17,472 | $143,078 |
| 2018 | $1,333 | $146,931 | $17,472 | $129,459 |
| 2017 | $4,447 | $146,931 | $17,472 | $129,459 |
| 2016 | $4,061 | $136,531 | $13,377 | $123,154 |
| 2015 | $2,746 | $130,033 | $13,377 | $116,656 |
| 2014 | $2,746 | $117,278 | $13,377 | $103,901 |
Source: Public Records
Map
Nearby Homes
- 13122 Eldridge Chase
- 13202 Chasworth Dr
- 7402 Burkridge Dr
- 13322 Chaston Dr
- 7315 Weatherhill Ln
- 13323 Firebrick Dr
- 13219 Vista Brook Dr
- 13215 Vista Oro Dr
- 7530 Lemma Dr
- 7511 Weatherhill Ln
- 7315 Millbrae Ln
- 7635 Log Cradle Dr
- 7607 Wovenwood Ln
- 7310 Blenheim Palace Ln
- 14311 Islandwoods Dr
- 7618 Mauna Kai Dr
- 6647 Signat Dr
- 7823 Autumn Hollow Ln
- 12931 Blackbrook Ln
- 7315 Muirfield Valley Dr
- 13223 Eldridge Chase
- 13215 Eldridge Chase
- 7010 Piney Meadow Ct
- 13227 Eldridge Chase
- 7006 Piney Meadow Ct
- 7014 Piney Meadow Ct
- 7107 Eldridge Chase Ct
- 7018 Piney Meadow Ct
- 13218 Eldridge Chase
- 13222 Eldridge Chase
- 7103 Eldridge Chase Ct
- 13214 Eldridge Chase
- 13226 Eldridge Chase
- 7002 Piney Meadow Ct
- 13210 Eldridge Chase
- 13206 Eldridge Chase
- 7115 Piney Meadow Ct
- 7003 Piney Meadow Ct
- 7111 Piney Meadow Ct
- 7102 Eldridge Chase Ct